정상 안저 소견을 보이는 제2형 당뇨 환자에서 대비감도 변화와 내측 망막두께 분석
Contrast Sensitivity and Inner Retinal Layer Thickness Analysis of Type 2 Diabetic Patients Without Retinopathy
Article information
Abstract
목적
정상 안저 소견을 보이는 제2형 당뇨 환자와 정상인의 대비감도를 비교하고 당뇨 환자의 내측 망막두께를 분석하여 대비감도 변화에 영향을 미치는 인자를 분석하고자 하였다.
대상과 방법
정상 안저 소견의 당뇨 환자 75안과 정상인 41안을 대상으로 암소시와 명소시 조건하에서 6.3°, 4.0°, 2.5°, 1.6°, 1.0°, 0.64°의 시각(degree)을 가진 시표에 대해 대비감도 역치를 측정하였고, 당뇨 환자에서는 빛간섭단층촬영을 이용하여 전체 망막두께, 망막신경섬유층(retinal nerve fiber layer, RNFL) 및 신경절세포-내망상층(ganglion cell-inner plexiform layer, GC-IPL)의 두께를 측정하였다.
결과
당뇨 환자군은 대조군에 비해 암소시 및 명소시의 모든 시각에서 대비감도 역치가 감소되었다. 당뇨 환자 중 대비감도 역치가 감소된 군은 감소되지 않은 군에 비해 유병 기간이 길었고, 전체 망막두께와 평균 GC-IPL 두께, 상측 RNFL과 상측 및 이측 GC-IPL 두께가 얇았다. 대비감도 저하의 위험인자는 당뇨 유병 기간과 전체 망막두께로 나타났다(각각 odds ratio=1.117, 0.942).
결론
제2형 당뇨 환자에서 당뇨의 유병 기간이 길어질수록 대비감도가 감소되며, 신경망막의 변성은 내측 망막 및 전체 망막두께 변화를 야기하고 대비감도 변화에 영향을 미칠 수 있는 것으로 사료된다. 따라서 유병 기간이 긴 당뇨 환자에서는 정상 안저 소견을 보인다 하여도 대비감도 변화와 빛간섭단층촬영상 망막두께의 변화에 유념할 필요가 있다.
Trans Abstract
Purpose
To compare the contrast sensitivities of type 2 diabetic patients without retinopathy and healthy subjects, and to assess the risk factors associated with a change in contrast sensitivity in diabetes.
Methods
A total of 75 (diabetic patients without retinopathy) and 41 (healthy subjects) eyes were reviewed from the medical records. The threshold of contrast sensitivity was measured at 6.3°, 4.0°, 2.5°, 1.6°, 1.0°, and 0.64° under scotopic and photopic states. Optical coherence tomography (OCT) imaging was used to measure the retinal nerve fiber layer (RNFL) thickness and ganglion cell-inner plexiform layer (GC-IPL) thickness in diabetic patients.
Results
Diabetic patients showed a lower threshold of contrast sensitivity at all degree measures than did the controls under both scotopic and photopic states. In subgroup analyses, diabetic patients with abnormal contrast sensitivity showed a longer duration of diabetes, decreased total retinal thickness, and decreased average GC-IPL, superior RNFL, superior GC-IPL, and temporal GC-IPL thicknesses. Multivariate logistic regression analyses showed that the duration of diabetes and total retinal thickness were significant predictive factors of decreased contrast sensitivity (odds ratio = 1.117 and 0.942, respectively).
Conclusions
As the duration of diabetes increased, the contrast sensitivity decreased in type 2 diabetic patients. Neuroretinal degeneration changes both the inner retinal thickness and total retinal thickness and affects contrast sensitivity. Therefore, for longer-term diabetic patients, it is necessary to consider the changes in contrast sensitivity and retinal thickness on OCT evaluation, even if the patient presents with normal fundus findings.
당뇨망막병증은 망막 미세혈관계의 순환 장애로 발생하며 진행하면 비가역적 손상을 초래할 수 있는 주요 실명 원인이다. 당뇨망막병증은 당뇨 환자의 1/3에서 발생하는 것으로 보고되며, 안저의 미세혈관류, 면화반, 삼출물, 신생혈관 등을 관찰하여 임상적으로 진단된다[1,2]. 당뇨병의 발생과 당뇨망막병증 임상징후 발생 사이에는 시간적 차이가 존재하는데, 신경망막 변성과 기능적 손상은 이미 이 단계에서 진행되어 망막 신경세포들의 변화가 미세혈관 변화에 선행하여 일어나는 것으로 보고되고 있다[3-5]. 따라서 정상 안저 소견을 보이는 당뇨 환자에서 기능적 손상과 당뇨망막병증 진행 위험을 조기에 발견하는 것은 환자를 적시에 관리하고 치료할 수 있는 기회를 제공한다.
대비감도검사는 서로 다른 대비를 갖는 대상을 구별하는 정도를 평가하며 다양한 크기와 대비에 대하여 시기능을 광범위하게 평가한다. 정상인의 대비감도는 시력과 서로 연관되어 있으나 백내장, 녹내장, 다발성경화증과 연관된 시신경염 등의 환자에서는 정상시력을 보여도 대비감도는 감소되어 나타날 수 있다[6-8]. 당뇨 환자에서는 당뇨망막병증이 임상적으로 발현되기 이전에 대비감도검사, 색각검사, 망막전위도검사, 미세시야계검사 등을 이용하여 시기능 이상을 조기에 발견할 수 있는 것으로 알려져 있으며, 최근에는 임상에서 보다 편리하게 이용할 수 있는 대비감도검사가 개발되어 사용되고 있다[3,9].
최근 빛간섭단층촬영(optical coherence tomography, OCT)의 발전으로 망막의 각 층을 정교하게 구분하여 정량적으로 평가하는 것이 가능해졌고, 황반부 또는 시신경질환에서 미세구조의 병태생리적 변화를 이해하는 데 도움이 되고 있다. 기존의 연구들은 당뇨망막병증이 없거나 미미한 혈관 변화만 있는 당뇨 환자에서 전체 망막두께가 정상인에 비해 감소되어 나타날 수 있다고 보고하였다[10,11]. 또한 당뇨 환자에서 내측 망막 즉, 망막신경섬유층(retinal nerve fiber layer, RNFL), 신경절세포-내망상층(ganglion cell-inner plexiform layer, GC-IPL)의 두께가 대조군에 비해 유의하게 감소된 것이 보고되기도 하였다[1,12,13].
이에 본 연구에서는 정상 안저 소견을 보이는 제2형 당뇨 환자와 정상인의 대비감도를 비교하여 당뇨 환자의 시기능 손실 여부와 정도를 조기에 평가하고자 하였다. 또한, 정상 안저 소견인 당뇨 환자의 전체 망막두께와 내측 망막두께를 분석하여 대비감도 변화에 영향을 미치는 인자를 알아보고자 하였다.
대상과 방법
본 연구는 후향적 연구로서 헬싱키선언(Declaration of Helsinki)을 준수하였으며 본원 연구윤리심의위원회(Institutional Review Board, 승인 번호: 116286-202006-HR-01)의 승인을 받았다. 2019년 11월부터 2020년 3월까지 당뇨망막병증 평가를 위해 본원 안과에 내원한 제2형 당뇨 환자 114명 중 정상 안저 소견을 보인 61명의 75안(단안 47명, 양안 14명)과 당뇨가 없고 정상 안저 소견인 36명 41안(단안 31명, 양안 5명)을 대상으로 의무기록을 후향적으로 조사하였다. 의무기록은 안과 및 전신병력을 조사하였고 한천석 시력표상 최대교정시력이 0.8 이상인 환자들만 포함되었다. 황반변성, 망막혈관폐쇄, 망막전막, 포도막염 등의 맥락망막질환이 있거나 녹내장 및 시신경염 등 시신경질환 과거력이 있는 경우, Lens Opacities Classification System III에서 백내장의 정도가 핵경화 2, 피질혼탁 2, 후낭하혼탁 2 이상인 경우, 백내장수술 이외의 안내수술을 시행받은 과거력이 있는 경우, -6 diopters (D) 이상과 +3 D 이상의 굴절이상, 사시안 등 결과에 영향을 줄 수 있는 경우는 제외하였다.
본 연구의 대상 환자들은 모두 최대교정시력, 자동굴절각막곡률계를 이용한 굴절력 측정, 비접촉식 안압계를 이용한 안압검사, 안저검사, 대비감도검사를 시행하였다. 당뇨 환자들은 0.5% Phenylephrine hydrochloride/tropicamide (Tropherine®; Hanmi Pharm. Co., Ltd., Seoul, Korea)를 점안한 후 세극등현미경하 안저검사를 시행하여 Early Treatment of Diabetic Retinopathy Study (ETDRS)에서 제시한 척도에 따라 당뇨망막병증의 유무를 평가하였고, 당뇨 환자가 아닌 경우는 무산동 안저사진기(KOWA VX-10i; Kowa, Shizuoka, Japan)를 이용하여 안저사진을 촬영한 후 이를 2명의 안과 전문의가 맹검법으로 판독하였다.
대비감도는 자동대비감도 측정기인 Contrast glare tester 2000 (CGT 2000; Takagi Seiko Corp., Takaoka, Japan)을 사용하여 눈부심(glare)이 없는 암소시(scotopic)와 명소시(photopic) 상태에서 각각 원거리(5 m) 6.3°, 4.0°, 2.5°, 1.6°, 1.0°, 0.64°의 시각(degree)을 가진 시표에 대해 대비 감도 역치를 측정하였다. 어두운 이중 고리 모양의 자극이 1초의 간격을 두고 0.6초 동안 0.0071에서 0.64까지 14단계의 수준으로 제시되었다. 각 시각 시표에 대하여 최대 수준의 대비가 제시된 후 점차 낮은 수준의 대비가 제시되는 동안 환자는 장비의 버튼을 눌러서 반응을 표시하고, 마지막으로 반응한 대비 수준을 환자의 대비감도 역치로 측정하였다. 대비감도 역치는 -log10을 취하여 통계적 분석이 용이하도록 하였다.
당뇨 환자들은 숙련된 단일 검사자에 의해 빛간섭단층촬영(3D OCT-1, Topcon, Tokyo, Japan)을 추가적으로 시행하였다. 3D macular horizontal scan을 이용해 6.0 × 6.0 mm의 황반 영역을 512 × 128 스캔하여 황반부 망막두께를 측정하였으며, 탑재된 자동 프로그램(software version 8.42)을 이용하여 내측 망막의 두께를 구하였다. 전체 망막층의 두께는 내경계막(internal limiting membrane)에서 부르크막까지의 두께로 하고, 내측 망막두께는 각각 RNFL과 GC-IPL의 두께를 구하는 것으로 하였다. ETDRS 격자에서 가장 안쪽 직경 1 mm 부위를 제외하고, 3 mm의 중간원과 6 mm의 바깥원, 그리고 2개의 교차하는 직선에 의해 구분된 나머지 8개 구역을 각각 내측과 외측의 평균을 구하여 상측, 하측, 비측, 이측으로 나누어 분석하였다. 이미지의 질은 Q-factor 50 (총 100) 이상의 신호 강도(signal strength)를 보인 것을 선택하였다.
자료는 평균과 표준편차, 최소값과 최대값의 범위로 제시하였다. 통계적인 분석은 IBM SPSS version 22.0 (IBM Corp., Armonk, NY, USA)을 이용하였다. 정상 안저 소견을 보이는 당뇨 환자와 정상군의 대비감도 비교 및 당뇨 환자군 중 대비감도가 저하된 군과 보존된 군의 망막두께를 포함한 지표들을 비교하기 위해 independent t-test를 사용하였고, 당뇨 환자군의 대비감도 변화에 영향을 미치는 인자들을 분석하기 위해 로지스틱 회귀분석(logistic regression analysis)을 이용하였다. 우선적으로 단변량 분석(univariate analysis)을 시행하여 p값이 0.1 이하인 인자들을 대상으로 다변량 분석(multivariate analysis)을 전진선택법(forward selection)으로 시행하였다. 모든 경우에서 p값이 0.05 미만일 때 통계적 의미가 있다고 하였다.
결 과
정상 안저 소견을 보이는 당뇨 환자 75안과 당뇨가 없고 정상 안저 소견을 보이는 41안이 분석되었으며, 당뇨 환자군의 평균 당뇨 유병 기간은 6.3 ± 6.1년이고 평균 당화혈색소는 7.4 ± 1.6%였다. 당뇨 환자군과 정상군의 나이는 각각 57.9 ± 9.3세(36-76세), 54.2 ± 10.9세(26-74세)로 두 군간 유의한 차이는 없었다. 또한 최대교정시력, 안압, 굴절력에 대해서 각 군 간의 유의한 차이는 없었다(Table 1).
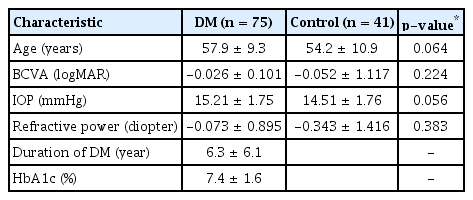
Demographic characteristics of subjects with DM and control subjects
CGT 2000을 사용한 대비감도검사상 암소시 6.3°, 4.0°, 2.5°, 1.6°, 1.0°, 0.64°의 모든 시각에서 당뇨 환자군의 대비감도 역치가 대조군보다 감소되어 있었고, 통계적으로 유의한 차이를 보였다(각각 p=0.005, p=0.015, p=0.001, p=0.001, p=0.001, p=0.002). 명소시에서도 6.3°, 4.0°, 2.5°, 1.6°, 1.0°, 0.64°의 모든 시각에서 당뇨 환자군이 대조군보다 대비감도 역치가 감소되어 있었으며 모든 시각에서 통계적으로 유의한 차이를 보였다(p<0.001 in all testing target) (Table 2, Fig. 1).
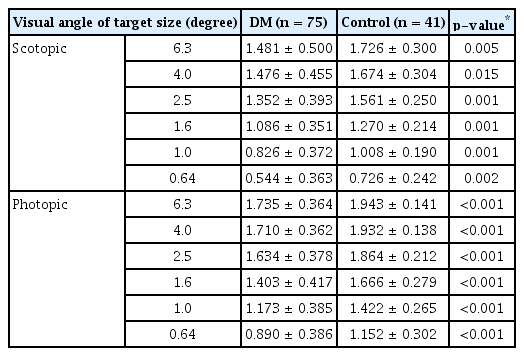
Summary of log unit of the contrast sensitivity measurements in subjects with DM and control subjects

Subgroup analysis in subjects with diabetes mellitus according to contrast sensitivity measurements
당뇨 환자 중 대비감도 역치가 하나 이상의 시각에서 제시된 정상 범위보다 감소된 환자를 분류하여 대비감도가 저하된 군과 보존된 군으로 나누고 하위그룹 분석을 시행하였다. 대비감도가 저하된 군은 22안(29.3%), 보존된 군은 53안(70.7%)이었다. 두 군은 연령, 시력, 안압, 굴절력 및 당화혈색소에서는 차이가 없었으나 대비감도가 저하된 군과 보존된 군의 당뇨 유병 기간은 각각 9.5 ± 6.9년과 5.0 ± 5.1년으로 대비감도가 저하된 군에서 길었으며 이는 통계적으로 유의하였다(p=0.004). 또한 대비감도가 저하된 군에서 전체 망막두께, 평균 RNFL 및 평균 GC-IPL의 두께가 모두 감소되었으며 전체 망막두께와 평균 GC-IPL 두께에서 통계적으로 유의한 차이를 보였다(각각 p=0.038, p=0.043). ETDRS 격자에 의한 내측 망막의 구역별 비교에서는 대비감도가 저하된 군에서 내측 망막 모든 구역의 두께 감소를 보였는데, 그 중 상측 RNFL과 상측 및 이측 GC-IPL에서 통계적으로 유의한 차이를 보였다(각각 p=0.041, p=0.033, p=0.028) (Table 3, Fig. 2).

Subgroup analysis in subjects with diabetes mellitus according to contrast sensitivity measurements
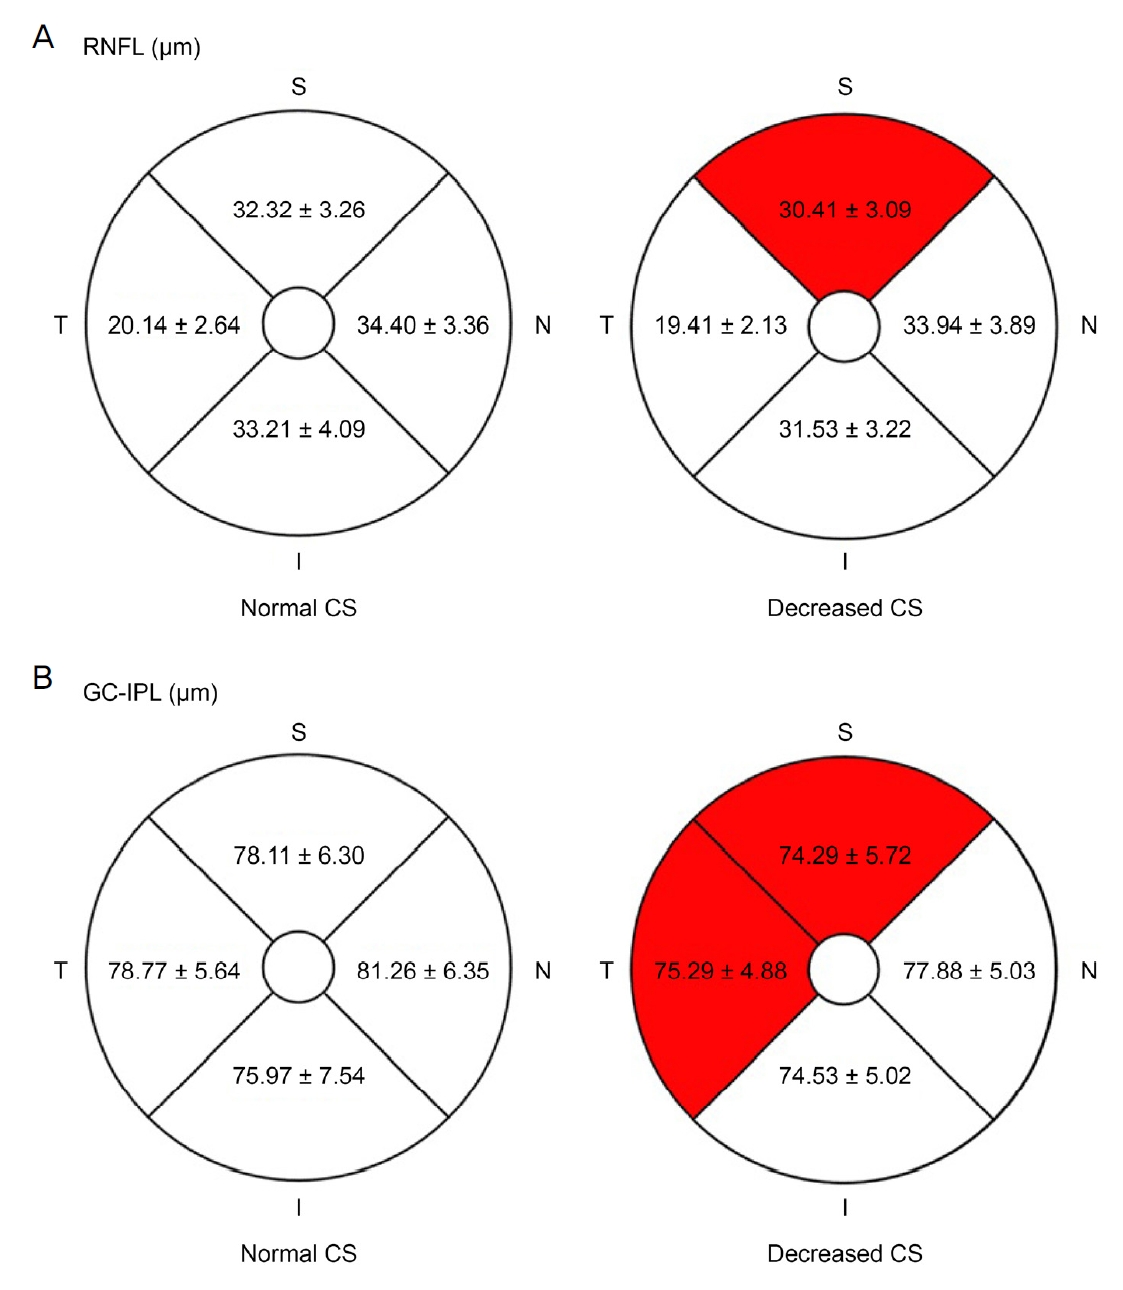
Inner retinal layer thickness of subgroup in 4 sectors of Early Treatment of Diabetic Retinopathy Study. Each sector is average of inner circle’s (3 mm diameter) and outer circle’s (6 mm diameter) inner retinal layer thickness, except 1 mm diameter circle at the center of the fovea. (A) Retinal nerve fiber layer (RNFL) thickness and (B) ganglion cell-inner plexiform layer (GC-IPL) thickness of normal and decreased contrast sensitivity (CS) measurements. Statistically significant sectors are red marked. S = superior; N = nasal; I = inferior; T= temporal.
당뇨 환자의 대비감도 저하에 대한 위험인자 분석에서는 단변량 분석 후 p값이 0.1 이하인 최대교정시력, 당뇨 유병 기간, 전체 망막두께, 상측 RNFL 두께, 평균, 상측, 비측 및 이측 GC-IPL의 두께로 다변량 분석을 시행하였다. 이 중 당뇨유병 기간(odds ratio, 1.117; 95% confidence interval, 1.008-1.239; p=0.035)과 전체 망막두께(odds ratio, 0.942; 95% confidence interval, 0.889-0.999; p=0.047)가 대비감도 감소에 대한 위험인자로 나타났다(Table 4).
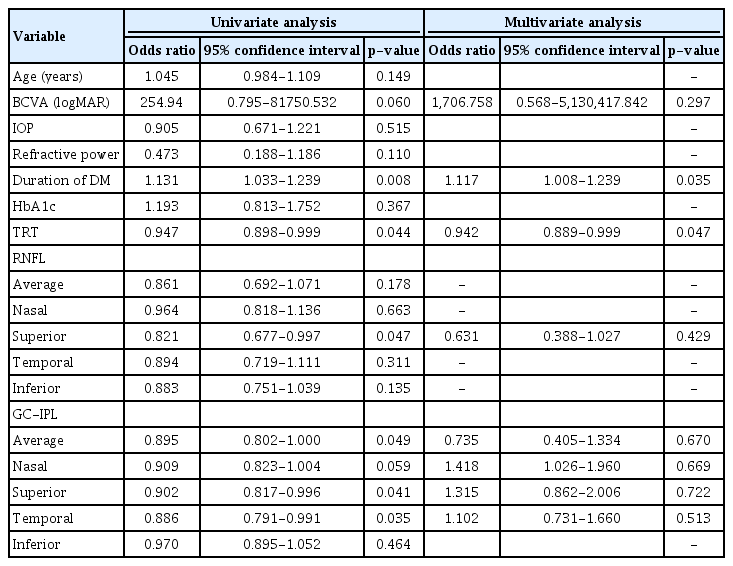
Univariate and multivariate analysis of the risk factors for decreased contrast sensitivity
고 찰
현재 당뇨 환자에서 대비감도 저하의 패턴을 정의하는 통합 알고리즘은 없으나, 당뇨망막병증의 발현 이전에 대비감도 저하가 발생하는 것에 대해서는 이미 잘 알려져 있다. Sokol et al [14]은 1형과 2형 당뇨 환자를 대상으로 한 연구에서 2형 당뇨 환자의 경우에만 낮은 공간 주파수에서 대비감도 저하가 나타난다고 하였고, Katz et al [15]은 당뇨막병증이 없는 당뇨 환자에서 명소시와 박명시 조건 중 박명 시의 낮은 공간 주파수에서 대비감도 저하를 보고하였다. Liska and Dostálek [16]은 모든 공간 주파수에서 당뇨망막병증이 없는 1형 당뇨 환자의 유의한 대비감도 저하를 보고하였고, Safi et al [17]은 중등도(500 lux) 및 어두운(2 lux 미만)배경에서 모든 공간주파수에 대해 당뇨 환자군의 유의한 대비감도 저하를 보고하였다. 기존의 연구들에서 대비감도는 Vistech VCTS-6500, CSV-1000 CS chart 등의 방법으로 측정되었는데, 본 연구에서 CGT 2000이 측정한 검사 시각 시표 6.3°, 4.0°, 2.5°, 1.6°, 1.0°, 0.64°를 기존 방법의 공간주파수에 대응하면 각각 1.1, 1.8, 2.9, 4.5, 7.1, 10.2 cycle per degree (cpd)에 해당된다[18]. 본 연구의 당뇨 환자의 대비감도가 암소시와 명소시 모든 시각에서 유의한 감소를 보인 것은 후자들의 연구에 상응하는 결과였다. 각 연구들이 결과에 차이를 보이는 이유는 연구 프로토콜의 다양성 및 대비감도 측정 방법의 상대적 차이 때문일 것으로 사료된다. 기존 대비감도 측정법인 Vistech contrast sensitivity test는 천장 효과(ceiling effect)로 정상안에서 높은 공간주파수의 대비감도가 감소한 것처럼 보이고 바닥 효과(floor effects)로 백내장안에서 낮은 공간주파수의 대비감도가 보존된 것처럼 보이는 제한점이 있으며, 검사 결과의 재현성도 떨어진다[19,20]. CSV-1000 CS chart는 연구에 따라 Vistech chart와 달리 천장 효과와 바닥 효과를 보이지 않아 임상적 유용성이 더 높이 평가되기도 하지만[21], 천장 효과와 바닥 효과가 나타나는 연구도 있다[22]. 따라서 이러한 점들을 고려하여 기존의 결과들을 비교해야 하며, 대비감도 저하의 패턴을 규정하기는 어려우나 각 연구에서 당뇨 환자의 당뇨망막병증 발현 이전에 저하된 대비감도를 보고하였다는 점은 공통되었다.
기존의 연구들을 통해 당뇨 환자에서 망막혈관손상의 가시적인 징후가 관찰되기 전에 신경망막의 변성이 유발된다는 결과들이 보고되었다. Barber et al [23]은 실험동물모델에서 신경망막세포의 세포자멸사는 당뇨를 유발시킨 지 1개월 이내에 발생할 수 있으며, 당뇨가 유발된 지 7.5개월째에 내망상층과 내핵층의 두께는 각각 22%, 14%의 감소를 보이고 신경절세포수는 10%의 감소를 보인다고 하였다. 또한 Spectral-domain OCT를 이용한 생체 내 망막 층간 두께 분석에서 내측 망막두께의 감소가 당뇨망막병증이 없는 당뇨 환자의 초기 OCT 소견으로 보고되었다[1,12,13]. 종단적 연구에서 내측 망막두께의 감소는 RNFL에서 0.25 μm/year, GC-IPL에서 0.29 μm/year로 보고되었으며 이는 망막 기능의 변화와 연관이 있었다[24,25]. 초기의 망막 변화가 주로 내측 망막에서 관찰되는 것은 내측 망막이 맥락막 순환계로 부터 혈액 공급을 받는 외측 망막에 비해 대사성 스트레스에 훨씬 취약하기 때문으로 이해되고 있다. 최근에는 빛간섭단층혈관촬영술의 발달로 당뇨망막병증의 초기 미세혈류 변화에 대한 연구가 활발히 이루어지고 있다. de Carlo et al [26]은 정상안에 비해 당뇨망막병증이 없는 당뇨 환자가 유의하게 오목무혈관부위(foveal avascular zone)가 넓다고 보고하였다. Ji and Kim [27]은 당뇨망막병증이 없는 당뇨 환자에서 심부모세혈관총(deep capillary plexus)의 오목무혈관부위가 표층모세혈관총(superficial capillary plexus)보다 유의하게 더 넓고, 당뇨의 유병 기간이 길수록 심부모세혈관총의 오목무혈관부위가 넓다고 하였다. 이러한 초기 혈류 변화 역시 당뇨 환자의 신경망막의 변성을 유발하는 인자로 생각된다.
본 연구에서는 당뇨 환자 중 대비감도 역치가 저하된 환자들이 대비감도가 보존된 환자들에 비해 당뇨 유병 기간이 길고, 전체 망막두께와 평균 GC-IPL 두께가 얇았으며 구역별 비교에서 상측 RNFL과 상측 및 이측 GC-IPL의 두께가 얇았다. 이는 대비감도가 저하된 환자들이 상대적으로 긴 당뇨 유병 기간 동안 누적된 신경망막의 변성을 경험하고 이는 내측 망막의 두께 감소와 시기능 저하로 이어질 수 있음을 시사한다. Montesano et al [25]은 당뇨 환자에서 GC-IPL 두께가 대비감도와 유의한 상관관계를 갖는다고 보고하였으며, Joltikov et al [28]은 당뇨망막부종이 없는 당뇨 환자에서 당뇨에 대한 초기 망막신경세포 반응이 망막내층의 변화를 야기하고 이는 망막기능의 저하와 연관이 있다고 하였다. Kern and Engerman [29]은 당뇨망막병증 실험동물 모델에서 미세혈관류와 망막출혈 같은 병변이 상측-이측 망막에서 하측-비측 망막에 비해 2배 이상 많이 관찰된다 하였고, Kim et al [30]은 당뇨망막병증이 없는 당뇨군에서 정상인에 비해 상측 신경절세포층과 내망상층의 의미 있는 두께 감소를 보고하였는데, 이는 본 연구에서 대비감도가 저하된 환자군의 상측 및 이측 GC-IPL 두께가 유의하게 감소된 것과 상응한다. 당뇨에 의한 신경망막의 변성이 상측에 우세하게 발생하는 기전은 아직 정확히 밝혀지지 않았으나, 망막의 상측 구역이 하측 구역에 비해 혈관 직경이 좁아 혈액 공급에 취약하고, 혈류 분포의 차이가 신경손상에 지형적 차이를 일으킬 수 있을 것으로 추측되고 있다[31].
본 연구에서 당뇨 환자의 대비감도 저하에 대한 위험인자로는 당뇨 유병 기간과 전체 망막두께로 나타났다(각각 odds ratio=1.117, odds ratio=0.942). 당뇨 환자를 대상으로 한 기존의 연구에서 Gella et al [32]은 대비감도 역치는 나이, 당뇨 유병 기간, 당화혈색소 수치, 알부민뇨증, 최대교정시력과 음의 상관관계를 보인다 하였고, Misra et al [33]은 대비감도 역치가 LogMAR 시력과 당화혈색소 수치와 유의한 연관이 있다고 하였다. 한편 내측 망막의 두께와 대비감도 역치 사이의 유의한 상관관계가 보고되기도 하였다[25,28,34]. 본 연구의 결과를 기존 연구와 비교 시에는 본 연구는 모두 당뇨망막병증이 없는 자로 시력이 0.8 이상인 환자를 대상으로 한 점, 조사된 유병 기간은 짧으나 지체된 진단으로 인해 실질적인 당뇨 유병 기간이 더 긴 환자들이 존재할 수 있다는 점, 전체 망막두께는 내층과 외층 망막두께를 모두 반영하나 본 연구는 외층 망막두께에 대한 분석이 없었다는 점 등을 고려해야 하겠다.
본 연구의 한계점은 다음과 같다. 첫째, 단일기관에서 진행된 후향적 단면연구라는 점이다. 둘째, 정상 대조군의 망막두께에 대한 조사가 이루어지지 않아 당뇨 환자와 대조군의 망막두께가 비교되지 않았다. 또한 정상 대조군의 안저평가는 무산동 안저촬영으로만 시행되어 망막 질환 감별에 부정확성이 있을 수 있다. 셋째, 대상자들의 초기 망막 변화로 신경섬유층과 GC-IPL의 변화를 분석하고 대비감도 변화와 연관성을 조사하였는데, 초기 당뇨망막병증에서 외측 망막두께와 대비감도의 연관성을 분석한 다른 연구가 있어 향후 신경교세포, 광수용체, 맥락막의 변화까지 포함하는 포괄적인 연구가 필요하다[35]. 또한 망막혈관 및 신경망막 변성에 영향을 줄 수도 있을 것으로 생각되는 고혈압, 총 콜레스테롤 및 지질 이상, 인슐린 사용 여부 등 다른 전신인자들에 대한 분석이 부재한데, 향후 이러한 점들을 보완하여 전향적 대규모 연구가 필요할 것으로 사료된다. 넷째, 한 환자에서 단안을 선택하여 결과의 신뢰성을 높여야 했으나 더 많은 증례를 확보하기 위해 불가피하게 한 환자에서 양안을 활용한 경우가 있다는 점이다.
결론적으로 저자들은 정상 안저 소견을 보이는 당뇨 환자의 대비감도가 암소시와 명소시의 모든 검사 시각에서 정상인에 비해 저하되어 있음과 이는 당뇨 환자에서 당뇨망막병증의 혈관 변화가 관찰되기 전에 발생하였음을 확인하였다. 또한 대비감도가 하나 이상의 시표에서 정상 범위보다 저하된 군은 당뇨 유병 기간이 길었고, 전체 망막두께와 평균 GC-IPL 두께가 얇았으며, 구역별 비교에서 상측 RNFL과 상측 및 이측 GC-IPL의 두께가 얇았다. 당뇨 환자의 대비감도 저하에 대한 위험인자는 긴 당뇨 유병 기간과 감소된 전체 망막두께였으며, 이 결과들을 종합할 때 당뇨 환자들은 당뇨 유병 기간이 길수록 누적된 신경망막의 변성을 경험하고, 야기된 내측 망막 및 전체 망막두께의 감소는 대비감도 변화에 영향을 미친다 할 수 있겠다. 따라서 임상의는 당뇨 환자의 안저검사시 정상 안저 소견을 보이는 당뇨 환자라 하더라도 신경망막의 변성이 일어나고 있을 가능성을 염두에 두어야 하며, 당뇨 유병 기간이 길어질수록 더욱 환자의 대비감도 저하 여부 및 OCT상 망막두께의 변화에 유의해야 할 것이다.
Notes
Conflict of Interest
The authors have no conflicts to disclose.
References
Biography
이경용 / Kyoung Yong Lee
삼육서울병원 안과
Department of Ophthalmology, Sahmyook Medical Center
