


ļ░▒ļé┤ņןņØĆ ņŗżļ¬ģĻ│╝ ņŗ£ļĀźņåÉņāüņØś ņŻ╝ņÜö ņøÉņØĖņØ┤ļ®░, ņ┤łņØīĒīīņłśņĀĢņ▓┤ņ£ĀĒÖöņłĀņØä ĒåĄĒĢ£ ļ░▒ļé┤ņן ņĀ£Ļ▒░ļŖö ņłśņłĀ Ēøä ļīĆļŗżņłśņØś ĒÖśņ×ÉņŚÉņä£ ņŗ£ļĀźņØä Ē¢źņāüņŗ£ĒéżļŖö Ļ░Ćņן ĒØöĒĢśĻ▓ī ņŗ£Ē¢ēļÉśļŖö ņĢłĻ│╝ņĀü ņłĀĻĖ░ņØ┤ļŗż[1,2]. ļ░▒ļé┤ņןņłśņłĀņØĆ ļ¦Øļ¦ēņŚÉļÅä ņśüĒ¢źņØä ļ»Ėņ╣śļŖöļŹ░, ĒśłņĢĪļ¦Øļ¦ēņןļ▓ĮņØś Ļ▓░ĒĢ©ņØä Ļ░ĆņĀĖņÖĆ ĒĢ®ļ│æņ”Øņ£╝ļĪ£ ļéŁĒżĒÖ®ļ░śļČĆņóģņØ┤ ņāØĻĖĖ ņłś ņ׳ņ£╝ļ®░, ļ╣øĻ░äņäŁļŗ©ņĖĄņ┤¼ņśü(optical coherence tomography, OCT) Ļ▓Ćņé¼ Ļ▓░Ļ│╝ ļ░▒ļé┤ņןņłśņłĀ Ēøä ĒÖ®ļ░śļæÉĻ╗śņØś ņ£ĀņØśļ»ĖĒĢ£ ņ”ØĻ░ĆĻ░Ć ļéśĒāĆļéśļŖö Ļ▓āņØ┤ ĒÖĢņØĖļÉśņŚłļŗż[3,4]. ļśÉĒĢ£ ļ░▒ļé┤ņןņłśņłĀ Ēøä ļ¦Øļ¦ēņŗĀĻ▓Įņä¼ņ£ĀņĖĄņØś ļæÉĻ╗ś ļ░Å ļ¦źļØĮļ¦ēņØś ļæÉĻ╗śĻ░Ć ņ”ØĻ░ĆĒĢ©ņØ┤ ļ│┤Ļ│ĀļÉśņŚłļŗż[5-7]. ĒĢ£ĒÄĖ ļ░▒ļé┤ņןņłśņłĀ Ēøä ņĢłņĢĢ Ļ░Éņåīļź╝ ĒåĄĒĢ┤ ņŻ╝ļĪ£ ļ¦źļØĮļ¦ēĒśłļźśļĪ£ļČĆĒä░ ņśżļŖö ļ░ĢļÅÖņĢłĒśłļźśņÖĆ ļ░ĢļÅÖņÜ®ņĀüņØ┤ ņ”ØĻ░ĆļÉśļŖö ņØ┤ļĪ£ņÜ┤ ņśüĒ¢źņØ┤ ļ│┤Ļ│ĀļÉśņŚłļŖöļŹ░[8,9], ļ░▒ļé┤ņןņłśņłĀņØ┤ ļ¦Øļ¦ēĒśłļźśņŚÉ ļ»Ėņ╣śļŖö ņśüĒ¢źņŚÉ ļīĆĒĢ┤ņä£ļŖö ĒÖĢņŗżĒ׳ ļ░ØĒśĆņ¦ä ļ░ö ņŚåļŗż.
ļ╣øĻ░äņäŁļŗ©ņĖĄĒśłĻ┤ĆņĪ░ņśüņłĀ(optical coherence tomography angiography)ņØĆ ļ╣Āļź┤Ļ▓ī ļ░śļ│ĄļÉśļŖö BņŖżņ║öņØä ĒåĄĒĢ┤ ĒśłĻ┤Ćļé┤ ņĀüĒśłĻĄ¼ņØś ņøĆņ¦üņ×äņØä Ļ░Éņ¦ĆĒĢśņŚ¼, ĒśĢĻ┤æņĢłņĀĆĒśłĻ┤ĆņĪ░ņśüņłĀĻ│╝ļŖö ļŗ¼ļ”¼ ņĪ░ņśüņĀ£ņØś ņé¼ņÜ® ņŚåņØ┤ ļ╣äņ╣©ņŖĄņĀüņ£╝ļĪ£ ļ¦Øļ¦ēĻ│╝ ļ¦źļØĮļ¦ēņØś Ēśłļźśļź╝ ņśüņāüĒÖöĒĢ£ļŗż[10]. ĒÖ®ļ░ś ļ¬©ņäĖĒśłĻ┤Ćņ┤ØņØĆ Ēæ£ņĖĄĻ│╝ ņŗ¼ļČĆļĪ£ ņØ┤ļŻ©ņ¢┤ņ¦Ćļ®░, Ēæ£ņĖĄ ļ¬©ņäĖĒśłĻ┤Ćņ┤Ø(superficial capillary plexus, SCP)ņØĆ ļé┤Ļ▓ĮĻ│äļ¦ē(internal limiting membrane)Ļ│╝ ļé┤ļ¦ØņāüņĖĄ(inner plexiform layer)ņØś ĒøäĻ▓ĮĻ│äļČĆ ņé¼ņØ┤ņŚÉ ņ£äņ╣śĒĢśĻ│Ā ņŗ¼ļČĆ ļ¬©ņäĖĒśłĻ┤Ćņ┤Ø(deep capillary plexus, DCP)ņØĆ ļé┤ļ¦ØņāüņĖĄņØś ĒøäĻ▓ĮĻ│äļČĆņÖĆ ņÖĖļ¦ØņāüņĖĄ(outer plexiform layer)ņØś ĒøäĻ▓ĮĻ│äļČĆ ņé¼ņØ┤ņŚÉ ņ£äņ╣śĒĢ£ļŗż[10]. ļ╣øĻ░äņäŁļŗ©ņĖĄĒśłĻ┤ĆņĪ░ņśüņłĀņØĆ ļé┤ļČĆņØś ņśüņāüņ▓śļ”¼ ņĢīĻ│Āļ”¼ņ”śņØä ĒåĄĒĢśņŚ¼ ņżæņŗ¼ņśżļ¬®ļ¼┤ĒśłĻ┤ĆļČĆņ£ä(foveal avascular zone, FAZ)ņØś ļ®┤ņĀüņØä ĻĄ¼ĒĢśĻ│Ā, ĒÖ®ļ░ś ļ¬©ņäĖĒśłĻ┤Ćņ┤ØņØś ĻĄ¼ņĪ░ļź╝ Ēæ£ņĖĄĻ│╝ ņŗ¼ļČĆļĪ£ ļČäļ”¼ĒĢśņŚ¼ Ļ░üĻ░üņØś ĒśłĻ┤Ćļ░ĆļÅä(vessel density) ļ░Å Ļ┤Ćļźśļ░ĆļÅä(perfusion density)ļź╝ ņĀĢļ¤ēņĀüņ£╝ļĪ£ ļČäņäØĒĢĀ ņłś ņ׳ļŗż[11,12]. ņØ┤ļ¤¼ĒĢ£ ļ╣øĻ░äņäŁļŗ©ņĖĄĒśłĻ┤ĆņĪ░ņśüņłĀņØä ņØ┤ņÜ®ĒĢśņŚ¼ ļ░▒ļé┤ņןņłśņłĀ Ēøä ĒÖ®ļ░śĒśłĻ┤Ć ĻĄ¼ņĪ░ņØś ļ│ĆĒÖöļź╝ ņŚ░ĻĄ¼ĒĢ£ Ļ▓░Ļ│╝, Zhao et al [13]ņØĆ ļ░▒ļé┤ņןņłśņłĀ Ēøä ļ░£ņāØĒĢ£ ņżæņŗ¼ņśżļ¬®ļČĆĻĘ╝ ļ░Å ņżæņŗ¼ņśżļ¬®ņŻ╝ņ£ä ĒśłĻ┤Ćļ░ĆļÅä ņ”ØĻ░ĆĻ░Ć 3Ļ░£ņøö ļÆż ņ£Āņ¦ĆļÉśņŚłņ£╝ļ®░, FAZņØś ļ®┤ņĀüņØĆ Ļ░ÉņåīĒĢśņśĆņØīņØä ļ│┤Ļ│ĀĒĢśņśĆļŗż. Zhou et al [14]ņØĆ ņżæņŗ¼ņśżļ¬®, ņżæņŗ¼ņśżļ¬®ļČĆĻĘ╝, ņżæņŗ¼ņśżļ¬®ņŻ╝ņ£ä SCPņÖĆ ņŗ£ņŗĀĻ▓Įņ£ĀļæÉņŻ╝ņ£äņØś ĒśłĻ┤Ćļ░ĆļÅä ļ░Å Ļ┤Ćļźśļ░ĆļÅäĻ░Ć ļ░▒ļé┤ņןņłśņłĀ 1ņŻ╝ Ēøä, 1Ļ░£ņøö ĒøäņŚÉ ņ”ØĻ░ĆĒĢśņśĆņØīņØä ļ│┤Ļ│ĀĒĢśņśĆļŗż. ļŗ╣ļć©ĒÖ®ļ░śļČĆņóģ, ļ¦Øļ¦ēņĀĢļ¦źĒÅÉņćä ĒÖśņ×ÉņŚÉņä£ļŖö ĒÖ®ļ░ś ļ»ĖņäĖĒśłļźśņØś Ļ░£ņäĀņØ┤ ņżæņŗ¼ņŗ£ļĀźņØś Ē¢źņāüņŚÉ Ēü░ ņśüĒ¢źņØä ņżä ņłś ņ׳ļŖö ņżæņÜöĒĢ£ ņÜöņØĖņ£╝ļĪ£ ļ│┤Ļ│ĀļÉśņŚłļŗż[15,16]. ĒĢśņ¦Ćļ¦ī ļ░▒ļé┤ņןņłśņłĀ Ēøä ļ░£ņāØĒĢ£ ņØ┤ļ¤░ ļŗ©ĻĖ░Ļ░äņØś ļ│ĆĒÖöĻ░Ć ņןĻĖ░ņĀüņ£╝ļĪ£ ņ¦ĆņåŹĒĢśļŖö ņ¦ĆņŚÉ ļīĆĒĢ┤ņä£ļŖö ņĢīļĀżņ¦ä ļ░ö ņŚåļŗż. ļśÉĒĢ£ ļ░▒ļé┤ņןņłśņłĀ Ēøä ĒÖ®ļ░śņŚÉ ļéśĒāĆļéśļŖö ņØ┤ļ¤¼ĒĢ£ ļ│ĆĒÖöļōżņØś ĻĖ░ņĀäņŚÉ ļīĆĒĢ┤ņä£ļÅä ņĀĢĒÖĢĒ׳ ĒÖĢļ”ĮļÉ£ ļ░ö ņŚåļŗż.
ļ│Ė ņŚ░ĻĄ¼ļŖö ļ░▒ļé┤ņןņłśņłĀ Ēøä 6Ļ░£ņøö ļÅÖņĢł ĒÖ®ļ░śņØś Ēæ£ņĖĄ ļ░Å ņŗ¼ļČĆ ļ¬©ņäĖĒśłĻ┤Ćņ┤Ø, ņŗ£ņŗĀĻ▓Įņ£ĀļæÉļé┤, ņŗ£ņŗĀĻ▓Įņ£ĀļæÉņŻ╝ņ£ä Ļ░üĻ░üņØś ĒśłĻ┤Ćļ░ĆļÅäņÖĆ FAZ ļ®┤ņĀüņØś ņŗ£Ļ░äņŚÉ ļö░ļźĖ ļ│ĆĒÖöļź╝ ļ╣øĻ░äņäŁļŗ©ņĖĄĒśłĻ┤ĆņĪ░ņśüņłĀņØä ņØ┤ņÜ®ĒĢśņŚ¼ ņĀĢļ¤ēņĀüņ£╝ļĪ£ ļČäņäØĒĢśņśĆļŗż. ļśÉĒĢ£ ļ░▒ļé┤ņןņłśņłĀ Ēøä ĒÖ®ļ░ś ļ¬©ņäĖĒśłĻ┤Ćņ┤Ø ĒśłĻ┤Ćļ░ĆļÅä ļ│ĆĒÖöļ¤ēĻ│╝ Ļ┤ĆĻ│äĻ░Ć ņ׳ļŖö ņØĖņ×Éļź╝ ļČäņäØĒĢśņŚ¼ ļ░▒ļé┤ņןņłśņłĀņØ┤ ĒÖ®ļ░ś Ēśłļźś ļ│ĆĒÖöļź╝ ņØ╝ņ£╝ĒéżļŖö ĻĖ░ņĀäņØś ņØ┤ĒĢ┤ņŚÉ ļÅäņøĆņØ┤ ļÉśĻ│Āņ×É ĒĢśņśĆļŗż.
ļīĆņāüĻ│╝ ļ░®ļ▓Ģ
ļ│Ė ņŚ░ĻĄ¼ļŖö 2018ļģä 7ņøöļČĆĒä░ 2019ļģä 6ņøöĻ╣īņ¦Ć ļ│ĖņøÉņŚÉņä£ ļģĖļģä ļ░▒ļé┤ņןņ£╝ļĪ£ ņ¦äļŗ©ļ░øĻ│Ā ļ░▒ļé┤ņןņłśņłĀņØä ļ░øņØĆ 24ļ¬ģ 24ņĢłņØä ļīĆņāüņ£╝ļĪ£ ņØśļ¼┤ĻĖ░ļĪØņØä ĒåĄĒĢ£ ĒøäĒ¢źņĀü ņŚ░ĻĄ¼ļź╝ ņ¦äĒ¢ēĒĢśņśĆļŗż. ļ│Ė ņŚ░ĻĄ¼ļŖö ĒŚ¼ņŗ▒ĒéżņäĀņ¢ĖņØä ņżĆņłśĒĢśņśĆĻ│Ā, ļ│ĖņøÉ ņŚ░ĻĄ¼ņ£żļ”¼ņŗ¼ņØśņ£äņøÉĒÜī(Institutional Review Board, IRB)ņØś ņŖ╣ņØĖ(ņŖ╣ņØĖ ļ▓łĒśĖ: 2019-3)ņØä ļ░øņĢä ņ¦äĒ¢ēĒĢśņśĆļŗż.
ĒÖśņ×ÉļōżņØĆ ĒĢ£ ļ¬ģņØś ļÅÖņØ╝ĒĢ£ ņłĀņ×ÉņŚÉ ņØśĒĢ┤ ļŗ©ņł£ ņłśņĀĢņ▓┤ņ┤łņØīĒīīņ£ĀĒÖöņłĀ ļ░Å Ēøäļ░®ņØĖĻ│ĄņłśņĀĢņ▓┤ ņéĮņ×ģņłĀņØä ļ░øņĢśņ£╝ļ®░, ņä▒Ļ│ĄņĀüņ£╝ļĪ£ ņłśņĀĢņ▓┤ļéŁ ļé┤ņŚÉ ņØĖĻ│ĄņłśņĀĢņ▓┤Ļ░Ć ņéĮņ×ģļÉśņŚłĻ│Ā 6Ļ░£ņøö ņØ┤ņāü Ļ▓ĮĻ│╝ Ļ┤Ćņ░░ĒĢ£ Ļ▓ĮņÜ░ļź╝ ņŚ░ĻĄ¼ ļīĆņāüņ£╝ļĪ£ ĒĢśņśĆļŗż. ņØ┤ņĀäņØś ļłł ņÖĖņāü ļśÉļŖö ņĢłĻ│╝ņĀü ņłśņłĀņØś ĻĖ░ņÖĢļĀźņØ┤ ņ׳Ļ▒░ļéś, ļ¦Øļ¦ēņ¦łĒÖś, ļģ╣ļé┤ņן ļ░Å ĒżļÅäļ¦ēņŚ╝ ļō▒ ļŗżļźĖ ņĢłĻ│╝ņĀü ņ¦łĒÖśņØ┤ ļÅÖļ░śļÉ£ Ļ▓ĮņÜ░ļŖö ņŚ░ĻĄ¼ņŚÉņä£ ņĀ£ņÖĖļÉśņŚłļŗż. ņĢłņĢĢņØ┤ 22 mmHg ņØ┤ņāüņØĖ Ļ▓ĮņÜ░, ņĢłņČĢņןņØ┤ 20.0 mm ļ»Ėļ¦ī ļśÉļŖö 25.0 mm ņ┤łĻ│╝ņØĖ Ļ▓ĮņÜ░ ņŚ░ĻĄ¼ ļīĆņāüņŚÉņä£ ņĀ£ņÖĖļÉśņŚłļŗż. Ļ▓Ćņé¼ ĒśæņĪ░ļÅäĻ░Ć ļČłļ¤ēĒĢśĻ▒░ļéś ļ╣øĻ░äņäŁļŗ©ņĖĄĒśłĻ┤ĆņĪ░ņśüņłĀ Ļ▓Ćņé¼Ļ▓░Ļ│╝ ņŗĀĒśĖĻ░ĢļÅä(scan quality index, SQI)Ļ░Ć 4/10 ļ»Ėļ¦īņØĖ Ļ▓ĮņÜ░ ņŚ░ĻĄ¼ ļīĆņāüņŚÉņä£ ņĀ£ņÖĖļÉśņŚłļŗż.
ļ¬©ļōĀ ĒÖśņ×ÉļōżņØä ļīĆņāüņ£╝ļĪ£ ņäĖĻĘ╣ļō▒Ēśäļ»ĖĻ▓ĮĻ▓Ćņé¼, ņĢłņĀĆĻ▓Ćņé¼, ņĄ£ļīĆĻĄÉņĀĢņŗ£ļĀźĻ▓Ćņé¼, ņ×ÉļÅÖĻ░üļ¦ēĻ│ĪļźĀĻ│ä(Auto Ref-Keratometer RK-F2; Canon, Inc., Tokyo, Japan)ļź╝ ņé¼ņÜ®ĒĢ£ ĻĄ¼ļ®┤ļĀīņ”łļīĆņØæņ╣ś ņĖĪņĀĢ, ļ╣äņĀæņ┤ēņĢłņĢĢĻ│ä(Full auto tonometer TX-F; Canon, Inc., Tokyo, Japan)ļź╝ ņé¼ņÜ®ĒĢ£ ņĢłņĢĢ ņĖĪņĀĢ, ļ╣øĻ░äņäŁļŗ©ņĖĄĒśłĻ┤ĆņĪ░ņśüņłĀ(RTVue XR Avanti┬«; Optovue, Inc., Fremont, CA, USA)ņØä ņŗ£Ē¢ēĒĢśņśĆļŗż. Ļ░üĻ░üņØś Ļ▓Ćņé¼ļŖö ļ¬©ļæÉ ļ░▒ļé┤ņןņłśņłĀĒĢśĻĖ░ ņĀä, ņłśņłĀ Ēøä 1ņŻ╝, 1Ļ░£ņøö, 3Ļ░£ņøö, 6Ļ░£ņøöņŚÉ ņŗ£Ē¢ēĒĢśņśĆļŗż. ņłĀ ņĀä ļ░▒ļé┤ņןņØś ņ¦äĒ¢ē ņĀĢļÅäļŖö Lens Opacities Classification System (LOCS) IIIņŚÉ ļö░ļźĖ ļČäļźśļź╝ ņŗ£Ē¢ēĒĢśņśĆņ£╝ļ®░, ņłĀ ņĀä ņĢłņČĢņןņØä IOL Master┬« (Carl Zeiss Meditec AG, Jena, Germany)ļź╝ ņé¼ņÜ®ĒĢśņŚ¼ ņĖĪņĀĢĒĢśņśĆļŗż. ĒÖ®ļ░ś SCPņÖĆ DCPņØś ĒśłĻ┤Ćļ░ĆļÅä ļ░Å ļ¦Øļ¦ēļæÉĻ╗ś, ņŗ£ņŗĀĻ▓Įņ£ĀļæÉ ļé┤ ĒśłĻ┤Ćļ░ĆļÅä, ņŗ£ņŗĀĻ▓Įņ£ĀļæÉņŻ╝ņ£ä ĒśłĻ┤Ćļ░ĆļÅä, FAZ ļ®┤ņĀü ļ│ĆĒÖöļŖö ĒĢśļéśņØś ļ╣øĻ░äņäŁļŗ©ņĖĄĒśłĻ┤ĆņĪ░ņśüņłĀ ĻĖ░Ļ│äņŚÉ ņØśĒĢ┤ Ļ░ÖņØĆ ļéĀ ļÅÖņŗ£ņŚÉ ņĖĪņĀĢļÉśņŚłņ£╝ļ®░ ĒÖ®ļ░śņśüņŚŁņØĆ ņżæņŗ¼ņśżļ¬®ņØä ĻĖ░ņżĆņ£╝ļĪ£ 6.0 ├Ś 6.0 mm ņśüņŚŁņØä, ņŗ£ņŗĀĻ▓Įņ£ĀļæÉņśüņŚŁņØĆ ņŗ£ņŗĀĻ▓Įņ£ĀļæÉļź╝ ĻĖ░ņżĆņ£╝ļĪ£ 4.5 ├Ś 4.5 mm ņśüņŚŁņØä ņ┤¼ņśüĒĢśņśĆļŗż. ļé┤ņןļÉ£ ņåīĒöäĒŖĖņø©ņ¢┤(RTVue XR, version 2018.1.0.33; Optovue, Inc.)ļź╝ ĒåĄĒĢ┤ ņĀĢļ®┤ ļ╣øĻ░äņäŁļŗ©ņĖĄĒśłĻ┤ĆņĪ░ņśü ņśüņāüņŚÉņä£ ĒÖ®ļ░ś SCPņÖĆ DCP, ņŗ£ņŗĀĻ▓Įņ£ĀļæÉļé┤, ņŗ£ņŗĀĻ▓Įņ£ĀļæÉņŻ╝ņ£äņØś ĒśłĻ┤Ćļ░ĆļÅä(vessel density, %), ļ¦Øļ¦ēļæÉĻ╗ś(╬╝m), FAZņØś ļ®┤ņĀü(mm2), ļ¦Øļ¦ēĻ│╝ ņŗ£ņŗĀĻ▓Įņ£ĀļæÉņØś SQIļź╝ ņ×ÉļÅÖņ£╝ļĪ£ ņĖĪņĀĢĒĢśņśĆļŗż[17]. ļ¦Øļ¦ēņØĆ ņ×ÉļÅÖņ£╝ļĪ£ SCPņÖĆ DCPļĪ£ ņäĖļČäĒÖöļÉśņŚłņ£╝ļ®░ SCPļŖö ļé┤Ļ▓ĮĻ│äļ¦ēņŚÉņä£ ļé┤ļ¦ØņāüņĖĄ 9 ╬╝m ņĢäļלĻ╣īņ¦Ć ĒżĒĢ©ĒĢśļÅäļĪØ ĒĢśņśĆĻ│Ā, DCPļŖö ļé┤ļ¦ØņāüņĖĄ 9 ╬╝m ņĢäļלļČĆĒä░ ņÖĖļ¦ØņāüņĖĄ 9 ╬╝m ņ£äĻ╣īņ¦Ć ĒżĒĢ©ĒĢśļÅäļĪØ ĒĢśņśĆļŗż. ņØ┤ļĢī ĒÖ®ļ░śņśüņŚŁņØĆ ņżæņŗ¼ņśżļ¬®(ņ¦üĻ▓Į 1 mm), ņżæņŗ¼ņśżļ¬®ļČĆĻĘ╝(ņ¦üĻ▓Į 3 mm), ņżæņŗ¼ņśżļ¬®ņŻ╝ņ£ä(ņ¦üĻ▓Į 6 mm)ļĪ£ ļéśļłäņ¢┤ņĀĖ Ļ░üĻ░üņØś ņśüņŚŁļ│ä SCPņÖĆ DCP ĒśłĻ┤Ćļ░ĆļÅä ļ░Å ņśüņŚŁļ│ä ĒÅēĻĘĀ ļ¦Øļ¦ēļæÉĻ╗śĻ░Ć ņĖĪņĀĢļÉśņŚłļŗż. ļ¦Øļ¦ēļæÉĻ╗śņØś ņĖĪņĀĢņØĆ Ļ░ü ņśüņŚŁļ│ä ĒÅēĻĘĀ ņĀäņ▓┤ ļ¦Øļ¦ēņĖĄ(total retinal layer, TRL) ļæÉĻ╗śļź╝ ņĖĪņĀĢĒĢśņśĆņ£╝ļ®░, ņĀäņ▓┤ ļ¦Øļ¦ēņĖĄņØĆ ļé┤Ļ▓ĮĻ│äļ¦ēņŚÉņä£ ļ¦Øļ¦ēņāēņåīņāüĒö╝(retinal pigment epithelium)Ļ╣īņ¦Ć ĒżĒĢ©ĒĢśļÅäļĪØ ĒĢśņśĆļŗż. ņŗ£ņŗĀĻ▓Įņ£ĀļæÉņśüņŚŁņØĆ ļé┤Ļ▓ĮĻ│äļ¦ēņŚÉņä£ ļ¦Øļ¦ēņŗĀĻ▓Įņä¼ņ£ĀņĖĄ Ēøäļ░® Ļ▓ĮĻ│ä ņé¼ņØ┤ņŚÉ ņ׳ļŖö ĒśłĻ┤Ćļ░ĆļÅäļź╝ ņĖĪņĀĢĒĢśņśĆļŖöļŹ░, ņŗ£ņŗĀĻ▓Įņ£ĀļæÉ ļé┤ņÖĆ ņŗ£ņŗĀĻ▓Įņ£ĀļæÉ Ļ▓ĮĻ│äņŚÉņä£ ņŚ░ņןļÉśļŖö 750 ╬╝m ļäłļ╣äņØś ĒāĆņøÉĒśĢ Ļ│Āļ”¼ ņśüņŚŁņ£╝ļĪ£ ņĀĢņØśļÉ£ ņŗ£ņŗĀĻ▓Įņ£ĀļæÉņŻ╝ņ£äņØś ļ░®ņé¼ļ¬©ņ¢æ ņ£ĀļæÉņŻ╝ņ£ä ļ¬©ņäĖĒśłĻ┤Ć(radial peripapillary capillary, RPC) ĒśłĻ┤Ćļ░ĆļÅäļź╝ ņĖĪņĀĢĒĢśņśĆļŗż[18].
ļ░▒ļé┤ņןņłśņłĀņØĆ 0.5% ĒæĖļĪ£ĒīīļØ╝ņ╣┤ņØĖņŚ╝ņé░ņŚ╝(Alcaine┬«; Alcon Laboratories, Forth Worth, TX, USA)ņØä ņØ┤ņÜ®ĒĢ£ ņĀÉņĢłļ¦łņĘ© Ēøä 2.2 mm Ēü¼ĻĖ░ņØś Ēł¼ļ¬ģ Ļ░üļ¦ē ņĀłĻ░£ļź╝ Ļ░ĆĒ¢łņ£╝ļ®░ ņŚ░ņåŹĻ│ĪņäĀņłśņĀĢņ▓┤ ļéŁņøÉĒśĢņĀłĻ░£ņłĀņØä ņŗ£Ē¢ēĒĢśņśĆļŗż. ņØ┤Ēøä ĒÅēĒśĢņŚ╝ņĢĪņØä ņØ┤ņÜ®ĒĢśņŚ¼ ņłśļĀźļČäļ”¼ņłĀņØä ņŗ£Ē¢ēĒĢśņśĆņ£╝ļ®░ Infinity Vision System (Alcon Laboratories, Forth Worth, TX, USA)ņØä ņé¼ņÜ®ĒĢśņŚ¼ ņ┤łņØīĒīīņłśņĀĢņ▓┤ņ£ĀĒÖöņłĀņØä ņŗ£Ē¢ēĒĢśņśĆļŗż. ņØ┤ņ¢┤ņä£ Ļ┤ĆļźśĒØĪņØĖĻĖ░ļĪ£ ļé©ņØĆ Ēö╝ņ¦łņØä ņĀ£Ļ▒░ĒĢśĻ│Ā ņĀæļŖö ņØĖĻ│ĄņłśņĀĢņ▓┤ enVista┬«MX60 (Bausch & Lomb, Rochesters, NY, USA)ļź╝ ĒøäļéŁņŚÉ ņéĮņ×ģĒĢśņśĆļŗż. ņłśņłĀ Ēøä ņ▓śņ╣śļŖö ļÅÖņØ╝ĒĢśĻ▓ī 0.5% ļĀłļ│┤ĒöīļĪØņé¼ņŗĀ(Cravit┬«; Santen Pharmaceutical Co., Ltd., Osaka, Japan)ņØä ĒĢśļŻ© 4ĒÜī, 0.1% ļĖīļĪ¼ĒÄśļéÖļéśĒŖĖļź©(Bronuck┬«; Taejoon Pharm., Seoul, Korea)ņØä ĒĢśļŻ© 2ĒÜī, ņłśņłĀ Ēøä 4ņŻ╝ ļÅÖņĢł ņĀÉņĢłĒĢśņśĆļŗż.
ĒåĄĻ│ä ļČäņäØņØĆ SPSS software ver. 18.0 (SPSS Inc., Chigaco, IL, USA)ņØä ņØ┤ņÜ®ĒĢśņśĆļŗż. ļ░▒ļé┤ņןņłśņłĀ Ēøä ņŗ£Ļ░äņŚÉ ļö░ļźĖ Ļ░ü ņśüņŚŁņØś ĒśłĻ┤Ćļ░ĆļÅä, FAZ ļ®┤ņĀü, Ļ░ü ņśüņŚŁņØś ļ¦Øļ¦ēļæÉĻ╗ś, ņĄ£ļīĆĻĄÉņĀĢņŗ£ļĀź, ļ¦Øļ¦ēĻ│╝ ņŗ£ņŗĀĻ▓Įņ£ĀļæÉņØś SQI, ĻĄ¼ļ®┤ļĀīņ”łļīĆņØæņ╣ś, ņĢłņĢĢ ļ│ĆĒÖöņØś ņ£ĀņØśņä▒ Ļ▓ĆņĀĢņØä ņ£äĒĢ┤ņä£ Ēöäļ”¼ļō£ļ¦ī Ļ▓ĆņĀĢ(Friedman test)ņØä ņØ┤ņÜ®ĒĢśņśĆļŗż. ļśÉĒĢ£ ļ░▒ļé┤ņןņłśņłĀ Ēøä ĒÖ®ļ░ś SCP, DCPņØś ĒśłĻ┤Ćļ░ĆļÅä ļ│ĆĒÖöņÖĆ SQI, ĻĄ¼ļ®┤ļĀīņ”łļīĆņØæņ╣ś, ņĢłņĢĢņØś ļ│ĆĒÖö, ņłĀ ņĀä ļ░▒ļé┤ņןņØś ņ¦äĒ¢ē ņĀĢļÅä, ļ¦Øļ¦ēļæÉĻ╗ś ļ│ĆĒÖö, ņĄ£ļīĆĻĄÉņĀĢņŗ£ļĀźņØś ļ│ĆĒÖö ņé¼ņØ┤ ņāüĻ┤ĆĻ┤ĆĻ│äļź╝ ņĢīņĢäļ│┤ĻĖ░ ņ£äĒĢ┤ ņŖżĒö╝ņ¢┤ļ¦ī ņł£ņ£äņāüĻ┤ĆļČäņäØ(Spearman rank correlation analysis)ņØä ņŗ£Ē¢ēĒĢśņśĆļŗż. ļśÉĒĢ£ SQI ļ│ĆĒÖöļ¤ē, ļ¦Øļ¦ēļæÉĻ╗ś ļ│ĆĒÖöļ¤ē, ļ░▒ļé┤ņן ņ¦äĒ¢ē ņĀĢļÅäĻ░Ć ĒÖ®ļ░ś SCP, DCP ĒśłĻ┤Ćļ░ĆļÅäļ│ĆĒÖöļ¤ēņŚÉ ņśüĒ¢źņØä ļ»Ėņ╣śļŖöņ¦Ć ņĢīņĢäļ│┤ĻĖ░ ņ£äĒĢ┤ ļŗżņżæĒÜīĻĘĆļČäņäØ(multiple regression analysis)ņØä ņé¼ņÜ®ĒĢśņśĆļŗż. ļ¬©ļæÉ p-valueĻ░Ć 0.05 ļ»Ėļ¦īņØĖ Ļ▓ĮņÜ░ļź╝ ĒåĄĻ│äņĀüņ£╝ļĪ£ ņ£ĀņØśĒĢ£ Ļ▓āņ£╝ļĪ£ ņĀĢņØśĒĢśņśĆļŗż.
Ļ▓░ Ļ│╝
ļ░▒ļé┤ņןņłśņłĀņØä ļ░øņØĆ ņ┤Ø 24ļ¬ģ 24ņĢłņØä ņŚ░ĻĄ¼ ļīĆņāüņ£╝ļĪ£ ĒżĒĢ©ĒĢ£ Ļ░ĆņÜ┤ļŹ░, ļīĆņāü ĒÖśņ×ÉņØś ĒÅēĻĘĀ ņŚ░ļĀ╣ņØĆ 66.50 ┬▒ 8.57ņäĖļĪ£, ļé©ņä▒ņØ┤ 10ļ¬ģ, ņŚ¼ņä▒ņØ┤ 14ļ¬ģņØ┤ņŚłļŗż. ņłĀ ņĀä ļ░▒ļé┤ņןņØś ņ¦äĒ¢ē ņĀĢļÅäļŖö LOCS III ļČäļźśņāü, ĒÅēĻĘĀ Ēö╝ņ¦łļ░▒ļé┤ņןņØĆ 1.96 ┬▒ 1.33, ĒĢĄļ░▒ļé┤ņןņØĆ 2.27 ┬▒ 1.32, ĒøäļéŁĒĢśļ░▒ļé┤ņןņØĆ 0.33 ┬▒ 0.76ņ£╝ļĪ£ Ļ┤Ćņ░░ļÉśņŚłņ£╝ļ®░ ņĄ£ļīĆĻĄÉņĀĢņŗ£ļĀźņØĆ ĒÅēĻĘĀ 0.35 ┬▒ 0.13 logarithm of minimal angle of resolution (logMAR)ņØ┤ņŚłļŗż. ņłĀ ņĀä ļ╣øĻ░äņäŁļŗ©ņĖĄĒśłĻ┤ĆņĪ░ņśüņłĀĻ▓Ćņé¼ņāü ļ¦Øļ¦ē SQIļŖö ĒÅēĻĘĀ 6.88 ┬▒ 1.15, ņŗ£ņŗĀĻ▓Įņ£ĀļæÉ SQIļŖö ĒÅēĻĘĀ 7.25 ┬▒ 1.26ņØ┤ņŚłļŗż. ņłĀ ņĀä ĒÅēĻĘĀ ĻĄ¼ļ®┤ļĀīņ”łļīĆņØæņ╣śļŖö 0.38 ┬▒ 2.32 diopters (D)ņØ┤ņŚłņ£╝ļ®░ ņĢłņČĢņןņØĆ 23.34 ┬▒ 0.73 mmņśĆļŗż. ņłĀ ņĀä ĒÅēĻĘĀ ņĢłņĢĢņØĆ 14.46 ┬▒ 3.07 mmHgņØ┤ņŚłļŗż(Table 1).
ņżæņŗ¼ņśżļ¬® SCPņØś ĒśłĻ┤Ćļ░ĆļÅäļŖö ļ░▒ļé┤ņןņłśņłĀ ņĀäĻ│╝ ņłśņłĀ Ēøä 1ņŻ╝, 1Ļ░£ņøö, 3Ļ░£ņøö, 6Ļ░£ņøöņŚÉ Ļ░üĻ░ü 15.42 ┬▒ 6.61%, 17.84 ┬▒ 6.80%, 18.32 ┬▒ 5.58%, 17.15 ┬▒ 5.97%, 17.20 ┬▒ 6.21%ņśĆņ£╝ļ®░, ņżæņŗ¼ņśżļ¬® DCPņØś ĒśłĻ┤Ćļ░ĆļÅäļŖö 28.43 ┬▒ 7.62%, 30.95 ┬▒ 6.92%, 31.14 ┬▒ 6.18%, 29.88 ┬▒ 7.14%, 30.52 ┬▒ 7.06%ļĪ£ ļéśĒāĆļéś ņżæņŗ¼ņśżļ¬® SCPņÖĆ DCPņØś ĒśłĻ┤Ćļ░ĆļÅäļŖö ņłśņłĀ ņĀäĻ│╝ ļ╣äĻĄÉĒĢśņŚ¼ ļ░▒ļé┤ņןņłśņłĀ Ēøä 1ņŻ╝, 1Ļ░£ņøö, 3Ļ░£ņøö, 6Ļ░£ņøöņŚÉ ļ¬©ļæÉ ņ£ĀņØśĒĢ£ ņ”ØĻ░Ćļź╝ ļ│┤ņśĆļŗż(p<0.001, p=0.001). ņżæņŗ¼ņśżļ¬®ļČĆĻĘ╝ SCPņØś ĒśłĻ┤Ćļ░ĆļÅäļŖö ņłĀ ņĀäĻ│╝ ņłĀ Ēøä 1ņŻ╝, 1Ļ░£ņøö, 3Ļ░£ņøö, 6Ļ░£ņøöņŚÉ Ļ░üĻ░ü 47.28 ┬▒ 5.76%, 50.83 ┬▒ 6.28%, 51.93 ┬▒ 4.60%, 50.32 ┬▒ 6.07%, 50.34 ┬▒ 5.00%ņśĆņ£╝ļ®░, ņżæņŗ¼ņśżļ¬®ļČĆĻĘ╝ DCPņØś ĒśłĻ┤Ćļ░ĆļÅäļŖö 53.06 ┬▒ 3.89%, 53.54 ┬▒ 4.94%, 55.58 ┬▒ 3.67%, 53.05 ┬▒ 6.84%, 53.90 ┬▒ 4.20%ļĪ£ ņżæņŗ¼ņśżļ¬®ļČĆĻĘ╝ SCPņÖĆ DCPņØś ĒśłĻ┤Ćļ░ĆļÅä ļśÉĒĢ£ ņłĀ ņĀäĻ│╝ ļ╣äĻĄÉĒĢśņŚ¼ ļ░▒ļé┤ņןņłśņłĀ Ēøä 1ņŻ╝, 1Ļ░£ņøö, 3Ļ░£ņøö, 6Ļ░£ņøöņŚÉ ļ¬©ļæÉ ņ£ĀņØśĒĢ£ ņ”ØĻ░Ćļź╝ ļ│┤ņśĆļŗż(p=0.002, p=0.014). ņżæņŗ¼ņśżļ¬®ņŻ╝ņ£ä SCPņØś ĒśłĻ┤Ćļ░ĆļÅäļŖö ņłĀ ņĀäĻ│╝ ņłĀ Ēøä 1ņŻ╝, 1Ļ░£ņøö, 3Ļ░£ņøö, 6Ļ░£ņøöņŚÉ Ļ░üĻ░ü 45.20 ┬▒ 5.01%, 48.52 ┬▒ 5.43%, 49.47 ┬▒ 4.93%, 48.36 ┬▒ 4.94%, 48.52 ┬▒ 4.32%ņśĆņ£╝ļ®░, ņżæņŗ¼ņśżļ¬®ņŻ╝ņ£ä DCPņØś ĒśłĻ┤Ćļ░ĆļÅäļŖö 46.62 ┬▒ 5.89%, 50.10 ┬▒ 7.08%, 53.16 ┬▒ 5.47%, 49.59 ┬▒ 8.70%, 50.96 ┬▒ 5.57%ļź╝ ļ│┤ņŚ¼ ņżæņŗ¼ņśżļ¬®ņŻ╝ņ£ä SCPņÖĆ DCPņØś ĒśłĻ┤Ćļ░ĆļÅä ļśÉĒĢ£ ņłĀ ņĀäĻ│╝ ļ╣äĻĄÉĒĢśņŚ¼ ņłĀ Ēøä 1ņŻ╝, 1Ļ░£ņøö, 3Ļ░£ņøö, 6Ļ░£ņøöņŚÉ ņ£ĀņØśĒĢ£ ņ”ØĻ░Ćļź╝ ļéśĒāĆļāłļŗż(p<0.001, p=0.002). ņŗ£ņŗĀĻ▓Įņ£ĀļæÉļé┤ ĒśłĻ┤Ćļ░ĆļÅäļŖö ļ░▒ļé┤ņןņłśņłĀ ņĀäĻ│╝ ņłśņłĀ Ēøä 1ņŻ╝, 1Ļ░£ņøö, 3Ļ░£ņøö, 6Ļ░£ņøöņŚÉ Ļ░üĻ░ü 47.22 ┬▒ 4.57%, 50.08 ┬▒ 4.54%, 49.40 ┬▒ 4.63%, 48.59 ┬▒ 6.28%, 49.60 ┬▒ 4.93%ņśĆņ£╝ļ®░, ņŗ£ņŗĀĻ▓Įņ£ĀļæÉņŻ╝ņ£ä ĒśłĻ┤Ćļ░ĆļÅäļŖö Ļ░üĻ░ü 51.03 ┬▒ 4.06%, 50.68 ┬▒ 3.93%, 49.75 ┬▒ 4.14%, 50.25 ┬▒ 3.51%, 50.74 ┬▒ 3.64%ļĪ£ ļéśĒāĆļéś ĒåĄĻ│äņĀüņ£╝ļĪ£ ņ£ĀņØśĒĢ£ ļ│ĆĒÖöĻ░Ć Ļ┤Ćņ░░ļÉśņ¦Ć ņĢŖņĢśļŗż(p=0.068, p=0.332). FAZ ļ®┤ņĀüņØĆ ņłĀ ņĀä 0.37 ┬▒ 0.12 mm2ņśĆņ£╝ļ®░, ņłĀ Ēøä 1ņŻ╝, 1Ļ░£ņøö, 3Ļ░£ņøö, 6Ļ░£ņøöņŚÉ Ļ░üĻ░ü 0.35 ┬▒ 0.11 mm2, 0.37 ┬▒ 0.10 mm2, 0.35 ┬▒ 0.10 mm2, 0.36 ┬▒ 0.11 mm2ļĪ£ ņ£ĀņØśĒĢ£ ļ│ĆĒÖöļŖö Ļ┤Ćņ░░ļÉśņ¦Ć ņĢŖņĢśļŗż(p=0.206) (Table 2).
ņżæņŗ¼ņśżļ¬®, ņżæņŗ¼ņśżļ¬®ļČĆĻĘ╝, ņżæņŗ¼ņśżļ¬®ņŻ╝ņ£ä Ļ░ü ņśüņŚŁļ│ä ĒÅēĻĘĀ ļ¦Øļ¦ēļæÉĻ╗śļŖö ļ░▒ļé┤ņןņłśņłĀ ņĀä Ļ░üĻ░ü 240.13 ┬▒ 20.78 ╬╝m, 310.75 ┬▒ 13.04 ╬╝m, 272.75 ┬▒ 13.55 ╬╝mņŚÉņä£ 1ņŻ╝ Ēøä 241.67 ┬▒ 21.70 ╬╝m, 315.29 ┬▒ 14.25 ╬╝m, 275.88 ┬▒ 14.23 ╬╝m, 1Ļ░£ņøöņŚÉ 247.25 ┬▒ 22.22 ╬╝m, 320.71 ┬▒ 14.98 ╬╝m, 281.29 ┬▒ 14.83 ╬╝m, 3Ļ░£ņøöņŚÉ 251.83 ┬▒ 23.12 ╬╝m, 324.04 ┬▒ 15.22 ╬╝m, 284.42 ┬▒ 15.29 ╬╝m, 6Ļ░£ņøöņŚÉ 250.58 ┬▒ 22.63 ╬╝m, 322.96 ┬▒ 14.67 ╬╝m, 282.46 ┬▒ 14.74 ╬╝mļĪ£ ļ¬©ļæÉ ņ£ĀņØśĒĢśĻ▓ī ņ”ØĻ░ĆĒĢśņśĆļŗż(ļ¬©ļæÉ p<0.001). ņĄ£ļīĆĻĄÉņĀĢņŗ£ļĀźņØĆ ņłĀ ņĀä ĒÅēĻĘĀ 0.35 ┬▒ 0.13 logMARņŚÉņä£ ņłĀ Ēøä 1ņŻ╝, 1Ļ░£ņøö, 3Ļ░£ņøö, 6Ļ░£ņøöņŚÉ Ļ░üĻ░ü 0.16 ┬▒ 0.14 logMAR, 0.12 ┬▒ 0.12 logMAR, 0.14 ┬▒ 0.13 logMAR, 0.16 ┬▒ 0.14 logMARļĪ£ ņ£ĀņØśĒĢśĻ▓ī ņ”ØĻ░ĆĒĢśņśĆļŗż(p<0.001). ļ¦Øļ¦ē SQIņÖĆ ņŗ£ņŗĀĻ▓Įņ£ĀļæÉ SQIļŖö ņłĀ ņĀä ĒÅēĻĘĀ 6.88 ┬▒ 1.15, 7.25 ┬▒ 1.26ņŚÉņä£ ņłĀ Ēøä 1ņŻ╝, 1Ļ░£ņøö, 3Ļ░£ņøö, 6Ļ░£ņøöņŚÉ ļ¦Øļ¦ē SQIļŖö 7.96 ┬▒ 0.91, 8.29 ┬▒ 0.81, 7.79 ┬▒ 1.25, 7.96 ┬▒ 1.00, ņŗ£ņŗĀĻ▓Įņ£ĀļæÉ SQIļŖö 8.25 ┬▒ 1.03, 8.58 ┬▒ 0.72, 8.21 ┬▒ 0.88, 8.33 ┬▒ 0.82ļĪ£ ļ¬©ļæÉ ņ£ĀņØśĒĢśĻ▓ī ņ”ØĻ░ĆĒĢśņśĆļŗż(p<0.001, p<0.001). ĒÅēĻĘĀ ĻĄ¼ļ®┤ļĀīņ”łļīĆņØæņ╣śļŖö ņłĀ ņĀä 0.38 ┬▒ 2.32 DņŚÉņä£ ņłĀ Ēøä 1ņŻ╝, 1Ļ░£ņøö, 3Ļ░£ņøö, 6Ļ░£ņøöņŚÉ Ļ░üĻ░ü -0.04 ┬▒ 0.74 D, -0.02 ┬▒ 0.55 D, -0.04 ┬▒ 0.57 D, -0.01 ┬▒ 0.58 DļĪ£ ņ£ĀņØśĒĢśĻ▓ī Ļ░ÉņåīĒĢśņśĆļŗż(p=0.021). ĒÅēĻĘĀ ņĢłņĢĢņØĆ ņłĀ ņĀä 14.46 ┬▒ 3.07 mmHgņŚÉņä£ ņłśņłĀ 1ņŻ╝ Ēøä 11.02 ┬▒ 2.89 mmHgņ£╝ļĪ£ Ļ░ÉņåīĒĢśņśĆņ£╝ļ®░, ņłĀ Ēøä 1Ļ░£ņøö, 3Ļ░£ņøö, 6Ļ░£ņøöņŚÉļÅä Ļ░üĻ░ü 11.57 ┬▒ 2.86 mmHg, 11.84 ┬▒ 2.69 mmHg, 11.68 ┬▒ 3.01 mmHgņ£╝ļĪ£ ņ£ĀņØśĒĢśĻ▓ī Ļ░ÉņåīļÉ£ ņ▒ä ņ£Āņ¦ĆļÉśņŚłļŗż(p<0.001) (Table 3).
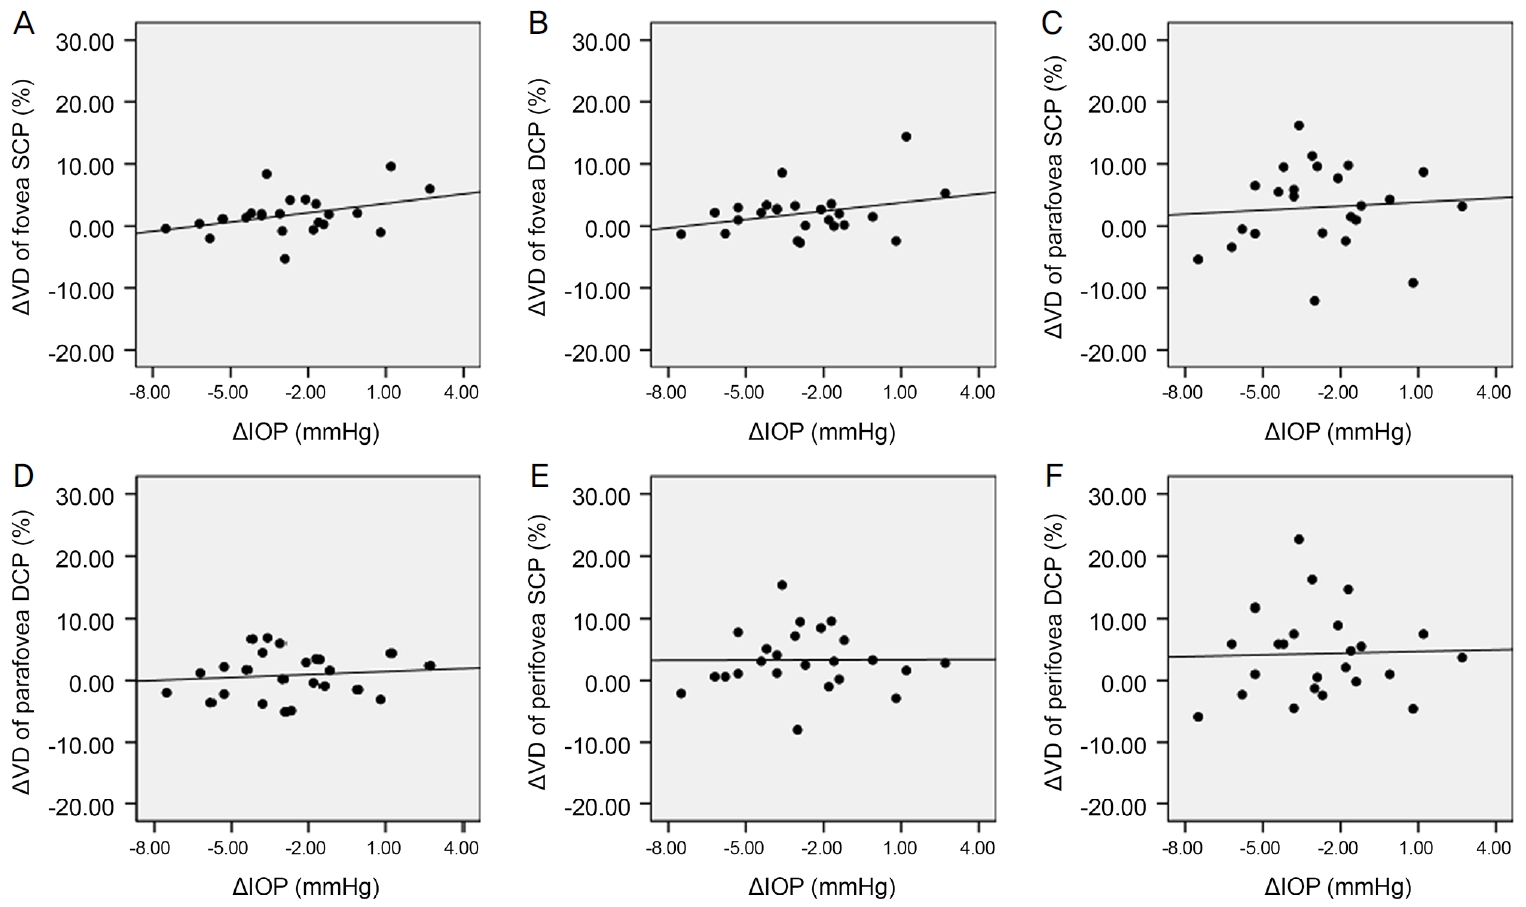
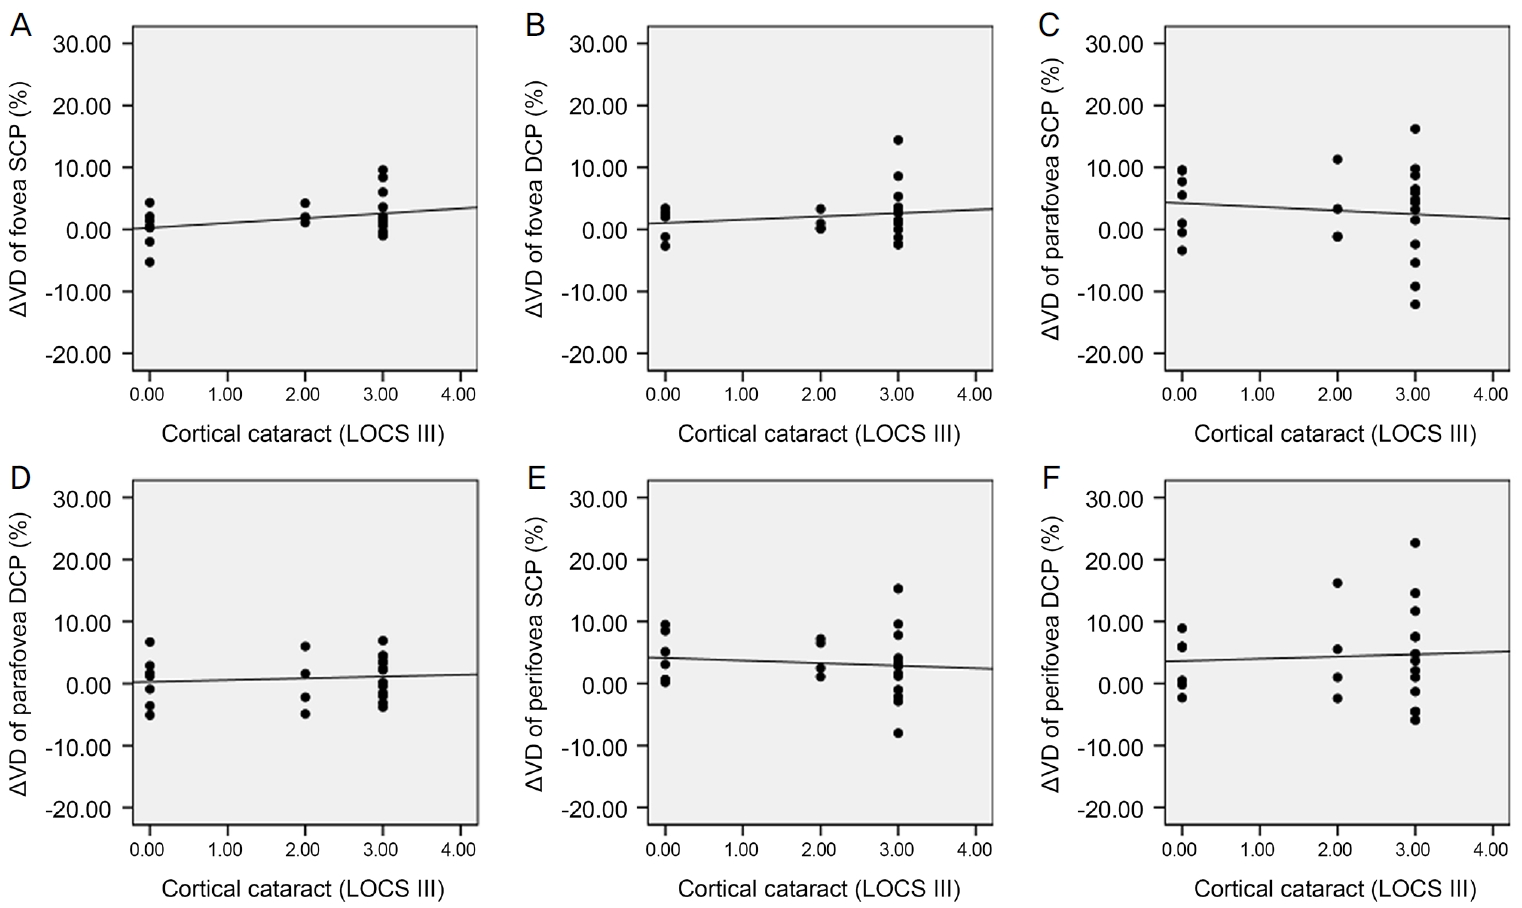
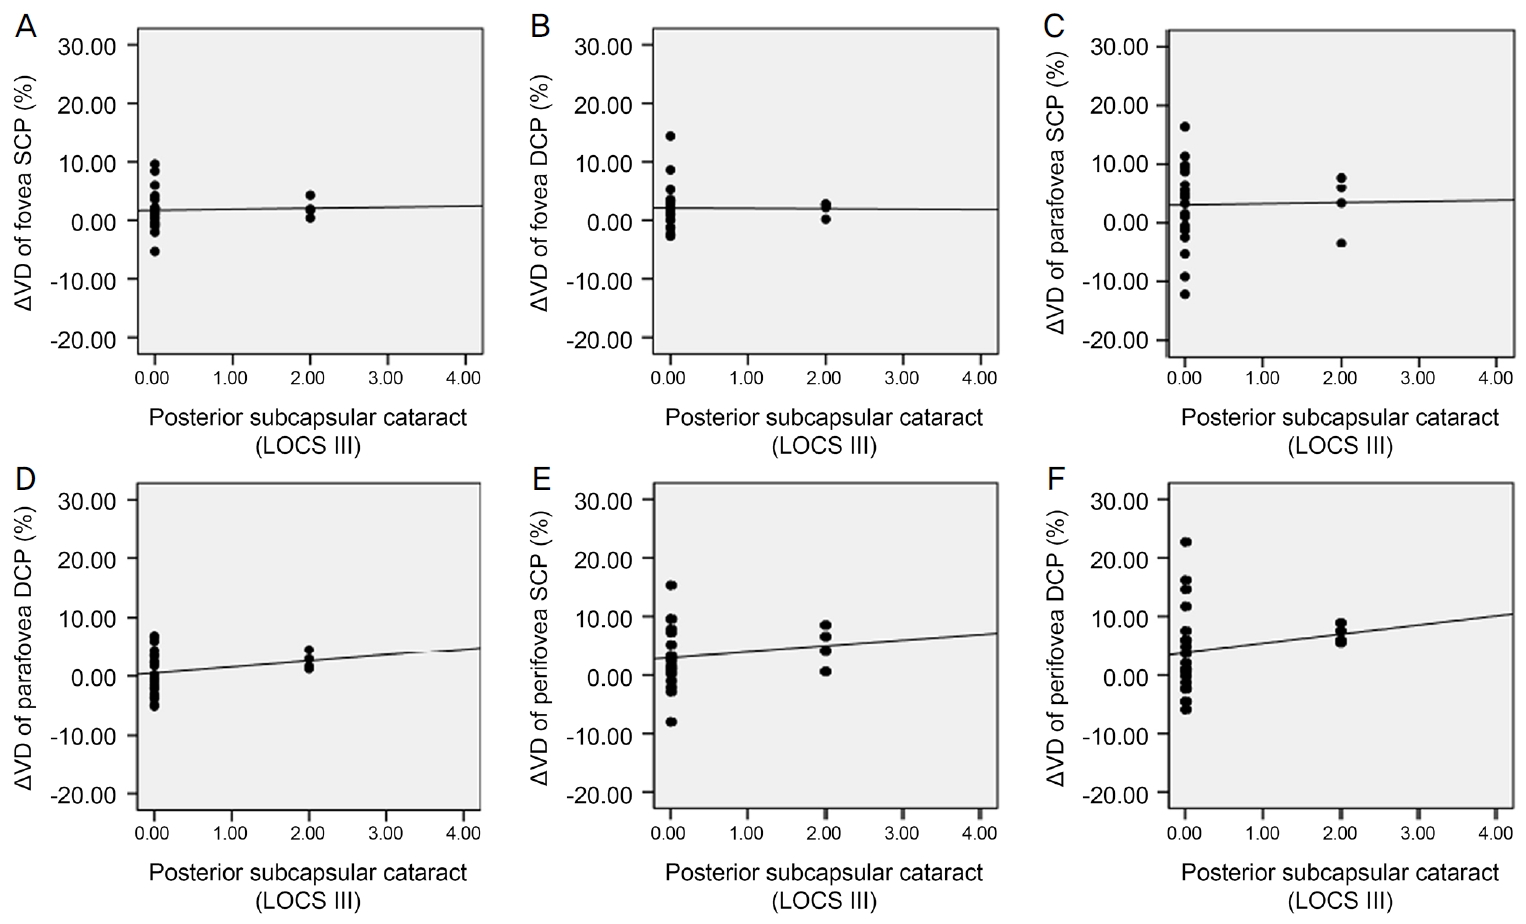
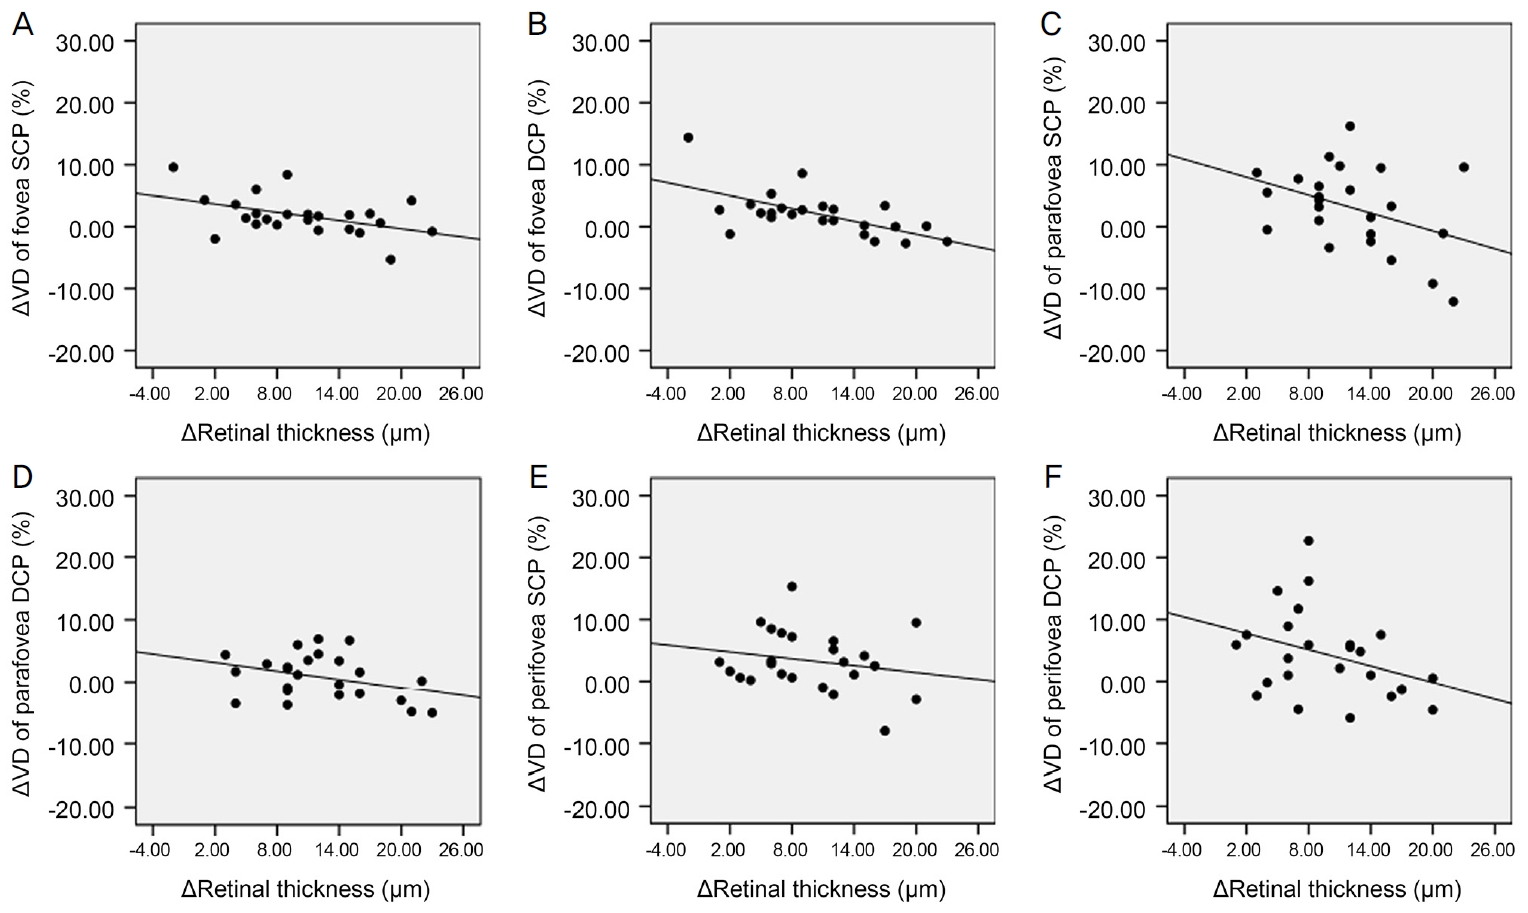
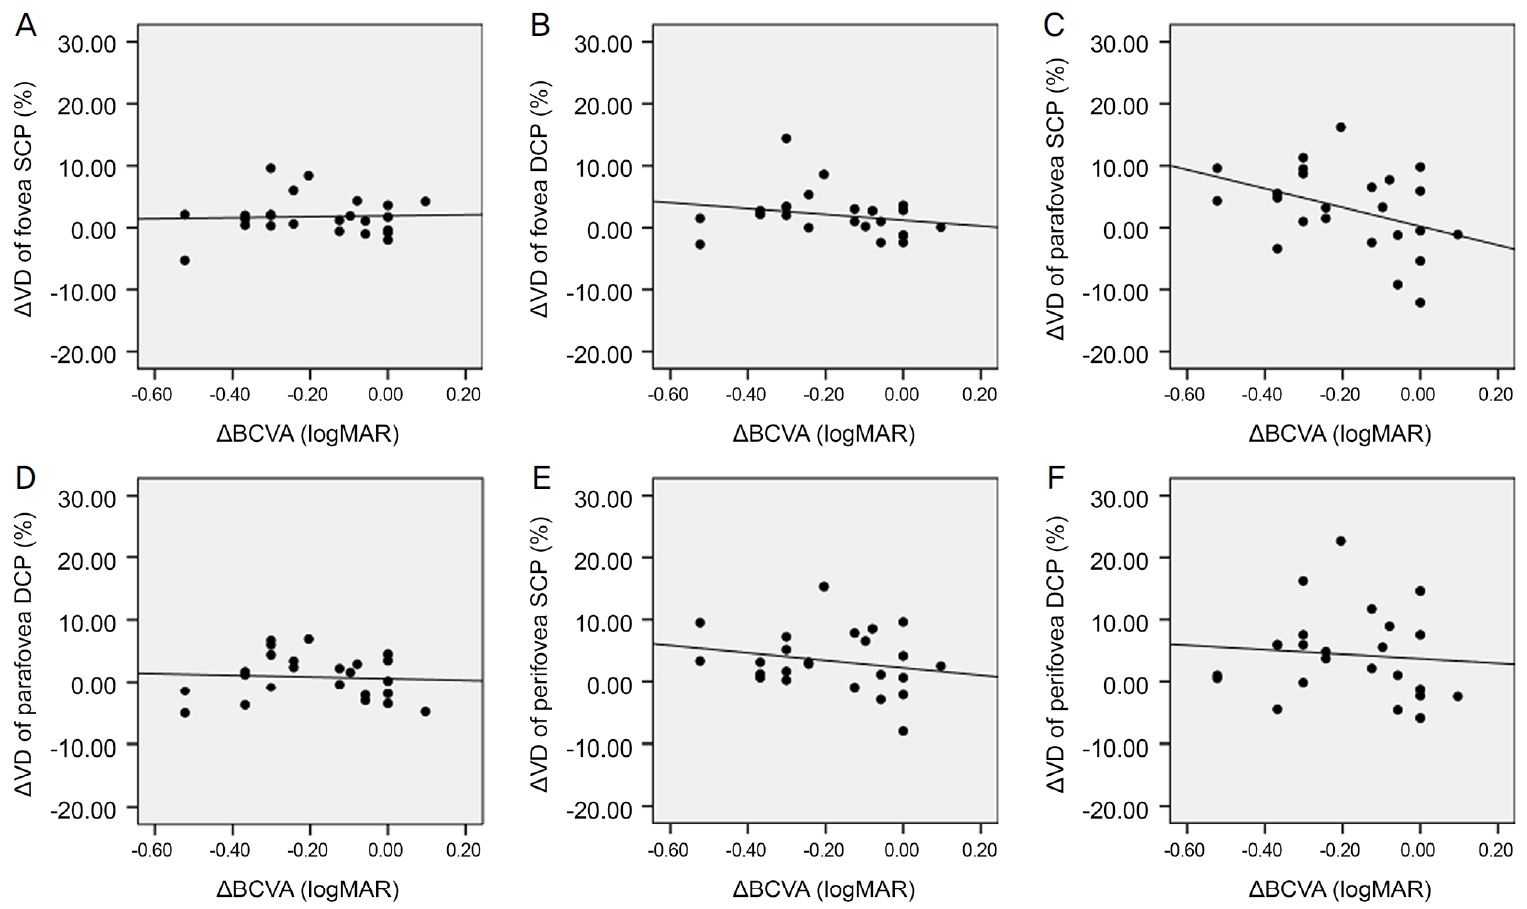
ļ░▒ļé┤ņןņłśņłĀ 6Ļ░£ņøö Ēøä SQI ļ│ĆĒÖöļŖö ņżæņŗ¼ņśżļ¬® SCPņÖĆ DCP ĒśłĻ┤Ćļ░ĆļÅä ļ│ĆĒÖö, ņżæņŗ¼ņśżļ¬®ļČĆĻĘ╝ SCPņÖĆ DCP ĒśłĻ┤Ćļ░ĆļÅä ļ│ĆĒÖö, ņżæņŗ¼ņśżļ¬®ņŻ╝ņ£ä SCPņÖĆ DCPņØś ĒśłĻ┤Ćļ░ĆļÅä ļ│ĆĒÖöņÖĆ Ļ░üĻ░ü ļ¬©ļæÉņŚÉņä£ ĒåĄĻ│äĒĢÖņĀüņ£╝ļĪ£ ņ£ĀņØśĒĢ£ ņ¢æņØś ņāüĻ┤ĆĻ┤ĆĻ│äĻ░Ć ņ׳ļŖö Ļ▓āņ£╝ļĪ£ ļéśĒāĆļé¼ļŗż(Ļ░üĻ░ü, Spearman correlation coefficient Žü=0.425, Žü=0.509, Žü=0.897, Žü=0.448, Žü=0.779, Žü=0.638; p<0.05 in all groups) (Fig. 1). ĒĢ£ĒÄĖ ļ░▒ļé┤ņןņłśņłĀ 6Ļ░£ņøö Ēøä ĻĄ¼ļ®┤ļĀīņ”łļīĆņØæņ╣śņØś ļ│ĆĒÖöņÖĆ ņżæņŗ¼ņśżļ¬® SCPņÖĆ DCP, ņżæņŗ¼ņśżļ¬®ļČĆĻĘ╝ SCPņÖĆ DCP, ņżæņŗ¼ņśżļ¬®ņŻ╝ņ£ä SCPņÖĆ DCPņØś ĒśłĻ┤Ćļ░ĆļÅä ļ│ĆĒÖö ņé¼ņØ┤ņŚÉļŖö Ļ░üĻ░ü ņ£ĀņØśĒĢ£ ņāüĻ┤ĆĻ┤ĆĻ│äĻ░Ć ņŚåņŚłļŗż(Ļ░üĻ░ü, Spearman correlation coefficient Žü=-0.370, -0.105, 0.317, 0.250, 0.422, 0.321; p>0.05 in all groups) (Fig. 2). ļ░▒ļé┤ņןņłśņłĀ 6Ļ░£ņøö Ēøä ņĢłņĢĢļ│ĆĒÖöņÖĆ ņżæņŗ¼ņśżļ¬® SCPņÖĆ DCP, ņżæņŗ¼ņśżļ¬®ļČĆĻĘ╝ SCPņÖĆ DCP, ņżæņŗ¼ņśżļ¬®ņŻ╝ņ£ä SCPņÖĆ DCPņØś ĒśłĻ┤Ćļ░ĆļÅä ļ│ĆĒÖö ņé¼ņØ┤ ļśÉĒĢ£ Ļ░üĻ░ü ņ£ĀņØśĒĢ£ ņāüĻ┤ĆĻ┤ĆĻ│äĻ░Ć ņŚåņŚłļŗż(Ļ░üĻ░ü, Spearman correlation coefficient Žü=0.311, Žü=0.088, Žü=0.072, Žü=0.093, Žü=0.061, Žü=0.004; p>0.05 in all groups) (Fig. 3). ņłĀ ņĀä ļ░▒ļé┤ņןņØś ņ¦äĒ¢ē ņĀĢļÅäļŖö ĒøäļéŁĒĢśļ░▒ļé┤ņןĻ│╝ ņłśņłĀ 1ņŻ╝ Ēøä ņżæņŗ¼ņśżļ¬®ļČĆĻĘ╝ DCP, ņżæņŗ¼ņśżļ¬®ņŻ╝ņ£ä DCPņØś ĒśłĻ┤Ćļ░ĆļÅä ļ│ĆĒÖö, Ēö╝ņ¦łļ░▒ļé┤ņןĻ│╝ 3Ļ░£ņøö Ēøä ņżæņŗ¼ņśżļ¬® SCPņØś ĒśłĻ┤Ćļ░ĆļÅä ļ│ĆĒÖö ņé¼ņØ┤ņŚÉļŖö ņ£ĀņØśĒĢ£ ņ¢æņØś ņāüĻ┤ĆĻ┤ĆĻ│äĻ░Ć ņ׳ļŖö Ļ▓āņ£╝ļĪ£ ļéśĒāĆļé¼ņ£╝ļéś(Ļ░üĻ░ü, Spearman correlation coefficient Žü=0.420, Žü=0.436, Žü=0.433; p<0.05 in all groups), ĻĘĖ ņÖĖ ļéśļ©Ėņ¦Ć ņśüņŚŁņŚÉņä£ļŖö 1ņŻ╝, 1Ļ░£ņøö, 3Ļ░£ņøö, 6Ļ░£ņøöņŚÉ ĒśłĻ┤Ćļ░ĆļÅä ļ│ĆĒÖöņÖĆ ļ¬©ļæÉ ņ£ĀņØśĒĢ£ ņāüĻ┤ĆĻ┤ĆĻ│äĻ░Ć ņŚåņŚłļŗż(Ļ░üĻ░ü, Spearman correlation coefficient, p>0.05 in all groups)(Fig. 4-6). ļ░▒ļé┤ņןņłśņłĀ Ēøä Ļ░ü ņśüņŚŁļ│ä ĒÅēĻĘĀ ļ¦Øļ¦ēļæÉĻ╗ś ļ│ĆĒÖöļŖö ņłśņłĀ Ēøä 1ņŻ╝, 1Ļ░£ņøö, 3Ļ░£ņøöņŚÉ ņżæņŗ¼ņśżļ¬®, ņżæņŗ¼ņśżļ¬®ļČĆĻĘ╝, ņżæņŗ¼ņśżļ¬®ņŻ╝ņ£ä ļ¬©ļōĀ ņśüņŚŁņŚÉņä£ ĒÖ®ļ░ś SCPņÖĆ DCP ĒśłĻ┤Ćļ░ĆļÅä ļ│ĆĒÖöņÖĆ ņ£ĀņØśĒĢ£ ņāüĻ┤ĆĻ┤ĆĻ│äĻ░Ć ņŚåņŚłļŗż(Ļ░üĻ░ü, Spearman correlation coefficient; p>0.05 in all groups). 6Ļ░£ņøö Ēøä ņżæņŗ¼ņśżļ¬® ļ¦Øļ¦ēļæÉĻ╗ś ļ│ĆĒÖöņÖĆ ņżæņŗ¼ņśżļ¬® DCP ĒśłĻ┤Ćļ░ĆļÅä ļ│ĆĒÖö ņé¼ņØ┤ņŚÉļŖö ņ£ĀņØśĒĢ£ ņØīņØś ņāüĻ┤ĆĻ┤ĆĻ│äĻ░Ć ņ׳ļŖö Ļ▓āņ£╝ļĪ£ ļéśĒāĆļé¼ņ£╝ļéś(Spearman correlation coefficient Žü=-0.572, p=0.003), ņżæņŗ¼ņśżļ¬® SCP ĒśłĻ┤Ćļ░ĆļÅä ļ│ĆĒÖöņÖĆļŖö ņ£ĀņØśĒĢ£ ņāüĻ┤ĆĻ┤ĆĻ│äĻ░Ć ņŚåņŚłņ£╝ļ®░ ņżæņŗ¼ņśżļ¬® ļČĆĻĘ╝ SCPņÖĆ DCP ĒśłĻ┤Ćļ░ĆļÅä ļ│ĆĒÖö, ņżæņŗ¼ņśżļ¬®ņŻ╝ņ£ä SCPņÖĆ DCP ĒśłĻ┤Ćļ░ĆļÅä ļ│ĆĒÖöļŖö ļ¬©ļæÉ Ļ░ü ņśüņŚŁņØś ļ¦Øļ¦ēļæÉĻ╗ś ļ│ĆĒÖöņÖĆ ņ£ĀņØśĒĢ£ ņāüĻ┤ĆĻ┤ĆĻ│äĻ░Ć ņŚåņŚłļŗż(Ļ░üĻ░ü, Spearman correlation coefficient Žü=-0.393, Žü=-0.310, Žü=-0.257, Žü=-0.140, Žü=-0.335; p>0.05 in all groups) (Fig. 7). ļ░▒ļé┤ņןņłśņłĀ 6Ļ░£ņøö Ēøä ņĄ£ļīĆĻĄÉņĀĢņŗ£ļĀź ļ│ĆĒÖöņÖĆ ņżæņŗ¼ņśżļ¬® SCPņÖĆ DCP, ņżæņŗ¼ņśżļ¬®ļČĆĻĘ╝ SCPņÖĆ DCP, ņżæņŗ¼ņśżļ¬®ņŻ╝ņ£ä SCPņÖĆ DCPņØś ĒśłĻ┤Ćļ░ĆļÅä ļ│ĆĒÖö ņé¼ņØ┤ ļśÉĒĢ£ Ļ░üĻ░ü ņ£ĀņØśĒĢ£ ņāüĻ┤ĆĻ┤ĆĻ│äĻ░Ć ņŚåņŚłļŗż(Ļ░üĻ░ü, Spearman correlation coefficient Žü=-0.092, Žü=-0.239, Žü=-0.353, Žü=-0.064, Žü=-0.203, Žü=-0.165; p>0.05 in all groups) (Fig. 8).
ļ░▒ļé┤ņןņłśņłĀ Ēøä ĒÖ®ļ░ś ļ¬©ņäĖĒśłĻ┤Ćņ┤Ø ĒśłĻ┤Ćļ░ĆļÅä ļ│ĆĒÖöņÖĆ ņāüĻ┤ĆĻ┤ĆĻ│äĻ░Ć ņ׳ļŖö Ļ▓āņ£╝ļĪ£ ļéśņś© SQI ļ│ĆĒÖöļ¤ē, ļ¦Øļ¦ēļæÉĻ╗ś ļ│ĆĒÖöļ¤ē, ļ░▒ļé┤ņן ņ¦äĒ¢ē ņĀĢļÅäĻ░Ć ĒÖ®ļ░ś SCP, DCP ĒśłĻ┤Ćļ░ĆļÅä ļ│ĆĒÖöļ¤ēņŚÉ ņśüĒ¢źņØä ļ»Ėņ╣śļŖöņ¦Ć ņĢīņĢäļ│┤ĻĖ░ ņ£äĒĢ┤ ļŗżņżæĒÜīĻĘĆļČäņäØņØä ņŗ£Ē¢ēĒĢ£ Ļ▓░Ļ│╝, SQI ļ│ĆĒÖöļ¤ēļ¦īņØ┤ ņżæņŗ¼ņśżļ¬® SCPņÖĆ DCP, ņżæņŗ¼ņśżļ¬®ļČĆĻĘ╝ SCPņÖĆ DCP, ņżæņŗ¼ņśżļ¬®ņŻ╝ņ£ä SCPņÖĆ DCPņØś ĒśłĻ┤Ćļ░ĆļÅäļ│ĆĒÖöņŚÉ ņ£ĀņØśĒĢ£ ņŚ░Ļ┤Ćņä▒ņØä Ļ░Ćņ¦ĆļŖö ņÜöņØĖņ£╝ļĪ£ ļéśĒāĆļé¼ļŗż(Ļ░üĻ░ü, Multiple regression analysis coefficient B=0.899, B=1.089, B=3.918, B=2.063, B=2.669, B=4.354; p<0.001 in all groups)(Table 4).
Ļ│Ā ņ░░
ļ│Ė ņŚ░ĻĄ¼ņŚÉņä£ļŖö ļ╣øĻ░äņäŁļŗ©ņĖĄĒśłĻ┤ĆņĪ░ņśüņłĀņØä ņØ┤ņÜ®ĒĢśņŚ¼ ļ░▒ļé┤ņןņłśņłĀ Ēøä ĒÖ®ļ░ś ļ¬©ņäĖĒśłĻ┤Ćņ┤ØņØś ĒśłĻ┤Ćļ░ĆļÅä ļ│ĆĒÖöņÖĆ FAZ ļ®┤ņĀüņØś 6Ļ░£ņøöĻ░äņØś ļ│ĆĒÖöļź╝ ņĢīņĢäļ│┤Ļ│Āņ×É ĒĢśņśĆļŗż. ļ│Ė ņŚ░ĻĄ¼ Ļ▓░Ļ│╝ ļ░▒ļé┤ņןņłśņłĀņØä ņŗ£Ē¢ēĒĢ£ 24ņĢłņŚÉņä£ ĒÖ®ļ░ś SCPņÖĆ DCPņØś ĒśłĻ┤Ćļ░ĆļÅä ļ¬©ļæÉ ņłĀ Ēøä 1ņŻ╝, 1Ļ░£ņøö, 3Ļ░£ņøö, 6Ļ░£ņøöņŚÉ ņżæņŗ¼ņśżļ¬®, ņżæņŗ¼ņśżļ¬® ļČĆĻĘ╝, ņżæņŗ¼ņśżļ¬®ņŻ╝ņ£ä ņäĖ ņśüņŚŁ ņĀäņ▓┤ņŚÉņä£ ņ£ĀņØśĒĢśĻ▓ī ņ”ØĻ░ĆĒĢśņśĆņ£╝ļ®░ ņØ┤ļ¤¼ĒĢ£ ļ│ĆĒÖöĻ░Ć ņłśņłĀ Ēøä 6Ļ░£ņøöņŚÉļÅä ņ£Āņ¦ĆļÉśņ¢┤ ņØ┤ņĀäņØś Zhao et al [13], Zhou et al [14]ņØś ņŚ░ĻĄ¼ņÖĆ ļ╣äĻĄÉĒ¢łņØä ļĢī ļŹö ņśżļל ņ£Āņ¦ĆļÉśļŖö ļ¬©ņŖĄņØä ļéśĒāĆļāłļŗż. ņŗ£ņŗĀĻ▓Įņ£ĀļæÉļé┤ ļ░Å ņŗ£ņŗĀĻ▓Įņ£ĀļæÉņŻ╝ņ£ä ĒśłĻ┤Ćļ░ĆļÅäļŖö ņ£ĀņØśļ»ĖĒĢ£ ļ│ĆĒÖöļź╝ ļ│┤ņØ┤ņ¦Ć ņĢŖņĢśņ£╝ļ®░, ļ░▒ļé┤ņןņłśņłĀ Ēøä ņŗ£ņŗĀĻ▓Įņ£ĀļæÉņŻ╝ņ£ä ĒśłĻ┤Ćļ░ĆļÅäĻ░Ć ņ£ĀņØśĒĢśĻ▓ī ņ”ØĻ░ĆĒĢ£ Zhou et al [14]ņØś ņŚ░ĻĄ¼ņÖĆļŖö ļŗżļźĖ Ļ▓░Ļ│╝ļź╝ ļéśĒāĆļāłļŗż. FAZ ļ®┤ņĀüņØĆ ņ£ĀņØśĒĢ£ ļ│ĆĒÖöĻ░Ć Ļ┤Ćņ░░ļÉśņ¦Ć ņĢŖņĢä ļ░▒ļé┤ņןņłśņłĀ Ēøä FAZ ļ®┤ņĀüņØ┤ ņ£ĀņØśĒĢśĻ▓ī Ļ░ÉņåīĒĢ£ Zhao et al [13]ņØś ņŚ░ĻĄ¼ņÖĆļŖö ļŗżļźĖ Ļ▓░Ļ│╝ļź╝ ļéśĒāĆļāłļŗż.
ļ░▒ļé┤ņןņłśņłĀ Ēøä ĒÖ®ļ░śņŚÉ ņØ╝ņ¢┤ļéśļŖö ļ│ĆĒÖöļōżņØ┤ ņ¢┤ļ¢ĀĒĢ£ ĻĖ░ņĀäņ£╝ļĪ£ ļéśĒāĆļéśļŖö ņ¦ĆļŖö ņĢäņ¦ü ļ¬ģĒÖĢĒĢśņ¦Ć ņĢŖņ¦Ćļ¦ī ņŚ¼ļ¤¼ Ļ░Ćņ¦Ć Ļ░ĆņäżļōżņØ┤ ņĀ£ĻĖ░ļÉśĻ│Ā ņ׳ļŗż. Yu et al [19]ņØś ņŚ░ĻĄ¼ Ļ▓░Ļ│╝ ļ░▒ļé┤ņןņłśņłĀņØä ĒåĄĒĢ£ ņłśņĀĢņ▓┤Ēś╝ĒāüņØś ņĀ£Ļ▒░ļŖö ņĢłĻĄ¼ ņøĆņ¦üņ×äņŚÉ ņØśĒĢ£ ņĖĪņĀĢ ņśżļźś(motion artifact)ļź╝ Ļ░Éņåīņŗ£ĒéżĻ│Ā, ĒÖ®ļ░śņØś ļ»ĖņäĖĒśłĻ┤ĆļōżņØ┤ ļŹö ņל ņŗ£Ļ░üĒÖöļÉ©ņ£╝ļĪ£ņŹ© SQIļź╝ ņ”ØĻ░Ćņŗ£ņ╝£ SCPņÖĆ DCPņØś Ļ┤Ćļźś ļ░Å ĒśłĻ┤Ćļ░ĆļÅä ņ”ØĻ░ĆņŚÉ ņ£ĀņØśĒĢ£ ņśüĒ¢źņØä ļ»Ėņ╣śļŖö Ļ▓āņ£╝ļĪ£ ļéśĒāĆļé¼ņ£╝ļéś SQIņØś ņ”ØĻ░ĆņŚÉļÅä ļČłĻĄ¼ĒĢśĻ│Ā FAZ ļ®┤ņĀüņØĆ ļ│ĆĒÖöĻ░Ć ņŚåņŚłļŗż. ņĢłĻĄ¼ ņøĆņ¦üņ×äņŚÉ ņØśĒĢ£ ņĖĪņĀĢ ņśżļźśļŖö ļČłļ¤ēĒĢ£ ņŗ£ļĀźĻ│╝ ļČłņĢłņĀĢĒĢ£ ņŻ╝ņŗ£ņŚÉ ņśüĒ¢źņØä ļ░øņ£╝ļ®░, ņłśņĀĢņ▓┤Ēś╝Ēāüņ£╝ļĪ£ ņØĖĒĢ┤ Ļ░ÉņåīļÉ£ ņŗ£ļĀźļÅä SQIņŚÉ ņśüĒ¢źņØä ņżä ņłś ņ׳ļŗż[20,21]. ļ│Ė ņŚ░ĻĄ¼ņŚÉņä£ ļ╣øĻ░äņäŁļŗ©ņĖĄĒśłĻ┤Ć ņĪ░ņśüņłĀĻ▓Ćņé¼ņØś SQIļŖö ļ░▒ļé┤ņןņłśņłĀ Ēøä 1ņŻ╝, 1Ļ░£ņøö, 3Ļ░£ņøö, 6Ļ░£ņøöņŚÉ ļ¬©ļæÉ ņ£ĀņØśĒĢśĻ▓ī ņ”ØĻ░ĆĒĢśņśĆņ£╝ļ®░, ņłĀ Ēøä 6Ļ░£ņøöņØś SQI ņ”ØĻ░ĆļŖö ĒÖ®ļ░ś SCPņÖĆ DCPņØś ĒśłĻ┤Ćļ░ĆļÅä ņ”ØĻ░ĆņÖĆ ņ£ĀņØśĒĢ£ ņ¢æņØś ņāüĻ┤ĆĻ┤ĆĻ│äĻ░Ć ņ׳ņŚłĻ│Ā, FAZ ļ®┤ņĀüņØĆ SQIņØś ņ”ØĻ░ĆņŚÉļÅä ļČłĻĄ¼ĒĢśĻ│Ā ņ£ĀņØśĒĢ£ ļ│ĆĒÖöĻ░Ć ņŚåņŚłļŗż. ļśÉĒĢ£ ļ░▒ļé┤ņןņłśņłĀ Ēøä SQI ļ│ĆĒÖöļ¤ē, ļ¦Øļ¦ēļæÉĻ╗ś ļ│ĆĒÖöļ¤ē, ļ░▒ļé┤ņן ņ¦äĒ¢ē ņĀĢļÅäņÖĆ ĒÖ®ļ░ś ļ¬©ņäĖĒśłĻ┤Ćņ┤Ø ĒśłĻ┤Ćļ░ĆļÅä ļ│ĆĒÖöļ¤ēņØś ļŗżņżæĒÜīĻĘĆļČäņäØ Ļ▓░Ļ│╝ SQI ļ│ĆĒÖöļ¦īņØ┤ ņżæņŗ¼ņśżļ¬®, ņżæņŗ¼ņśżļ¬®ļČĆĻĘ╝, ņżæņŗ¼ņśżļ¬®ņŻ╝ņ£ä SCPņÖĆ DCPņØś ĒśłĻ┤Ćļ░ĆļÅä ļ│ĆĒÖöņŚÉ ņśüĒ¢źņØä ļ»Ėņ╣śļŖö ņÜöņØĖņ£╝ļĪ£ ļéśĒāĆļé¼ļŗż. ĻĘĖļ¤¼ļ»ĆļĪ£ ļ░▒ļé┤ņןņłśņłĀ Ēøä ņłśņĀĢņ▓┤Ēś╝ĒāüņØś ņĀ£Ļ▒░ļź╝ ĒåĄĒĢ£ SQIņØś ņ”ØĻ░ĆĻ░Ć ņłĀ Ēøä ņĖĪņĀĢļÉ£ ĒÖ®ļ░ś ļ¬©ņäĖĒśłĻ┤Ćņ┤Ø ĒśłĻ┤Ćļ░ĆļÅäņØś ņ”ØĻ░ĆņŚÉ ņ£ĀņØśĒĢ£ ņśüĒ¢źņØä ļ»Ėņ│żļŗżļŖö Ļ▓āņØä ņĢī ņłś ņ׳ļŗż. ĒĢśņ¦Ćļ¦ī SQIņØś ņ”ØĻ░ĆĻ░Ć FAZ Ļ▓ĮĻ│äņĖĪņĀĢņŚÉļŖö ņśüĒ¢źņØä ļ»Ėņ╣śņ¦Ć ņĢŖņĢśņØä Ļ▓āņØ┤ļŗż.
ĒĢ£ĒÄĖ, ļ░▒ļé┤ņןņłśņłĀ Ēøä ļ░£ņāØĒĢśļŖö ĻĄ¼ļ®┤ļĀīņ”łļīĆņØæņ╣ś ļ│ĆĒÖöņŚÉ ņØśĒĢ£ ņśüĒ¢źņØä Ļ│ĀļĀżĒĢ┤ ļ│╝ ņłś ņ׳ļŗż. Li et al [22]ņØĆ ĒÅēĻĘĀ -6 D ĻĄ┤ņĀłņØ┤ņāüņØś Ļ│ĀļÅäĻĘ╝ņŗ£ņĢłĻ│╝ ņĀĢņāüņĢłņØä ļīĆņāüņ£╝ļĪ£ ĒÖ®ļ░ś ļ¬©ņäĖĒśłĻ┤Ćņ┤ØņØś ĒśłĻ┤Ćļ░ĆļÅäļź╝ ļ╣äĻĄÉ ļČäņäØĒĢ┤ ļ│Ė Ļ▓░Ļ│╝, ņĀĢņāüņĢłņŚÉ ļ╣äĒĢ┤ Ļ│ĀļÅäĻĘ╝ņŗ£ņĢłņØĆ SCPņÖĆ DCPņØś ĒśłĻ┤Ćļ░ĆļÅäĻ░Ć ļ¬©ļæÉ Ļ░ÉņåīĒĢśņśĆņ£╝ļ®░, ĻĄ¼ļ®┤ļĀīņ”łļīĆņØæņ╣śļ│┤ļŗżļŖö Ļ│ĀļÅäĻĘ╝ņŗ£ļĪ£ ņØĖĒĢ┤ ņĢłņČĢņןņØ┤ ĻĖĖņ¢┤ņ¦ĆĻ│Ā ļ¦Øļ¦ēņØ┤ ļŖśņ¢┤ļéśļ®░ ņāØĻĖ┤ ļ│æņĀü ļ│ĆĒÖöņŚÉ ņØśĒĢ£ ņśüĒ¢źņ£╝ļĪ£ ļ│┤ņĢśļŗż. ļŗ©, ņĀĢņāüņĢłņŚÉņä£ļŖö SCPņÖĆ DCPņØś ĒśłĻ┤Ćļ░ĆļÅäĻ░Ć ņĢłņČĢņןņØ┤ ņĢäļŗī ĻĄ¼ļ®┤ļĀīņ”łļīĆņØæņ╣śņÖĆ ņ£ĀņØśĒĢ£ Ļ┤ĆĻ│äĻ░Ć ņ׳ļŖö Ļ▓āņ£╝ļĪ£ ļ│┤Ļ│ĀĒĢśņśĆļŗż. Chen et al [23]ņØĆ Ļ│ĀļÅäĻĘ╝ņŗ£ņĢłņØä ļīĆņāüņ£╝ļĪ£ small incision lenticule extractionņØä ņŗ£Ē¢ēĒĢ£ Ēøä 1ņØ╝, 1ņŻ╝, 1Ļ░£ņøö ĒøäņØś ļ¦Øļ¦ēņØś ĒśłĻ┤Ćļ░ĆļÅä ļ│ĆĒÖöļź╝ ņŚ░ĻĄ¼ĒĢ┤ļ│Ė Ļ▓░Ļ│╝ ĻĄ¼ļ®┤ļĀīņ”łļīĆņØæņ╣śļŖö 1ņØ╝, 1ņŻ╝, 1Ļ░£ņøö Ēøä ļ¬©ļæÉ ņ£ĀņØśĒĢśĻ▓ī ņ”ØĻ░ĆĒĢśņśĆņ¦Ćļ¦ī, ņżæņŗ¼ņśżļ¬®ļČĆĻĘ╝Ļ│╝ ņżæņŗ¼ņśżļ¬®ņŻ╝ņ£ä SCPņÖĆ DCPņØś ĒśłĻ┤Ćļ░ĆļÅäļŖö ņłśņłĀ Ēøä 1ņØ╝ņŚÉ Ļ░ÉņåīĒĢśņśĆļŗżĻ░Ć 2ņŻ╝ ĒøäļČĆĒä░ļŖö ņłĀ ņĀäĻ│╝ Ļ░ÖņØĆ ņāüĒā£ļĪ£ ļÅīņĢäņÖöņ£╝ļ®░ ĻĄ¼ļ®┤ļĀīņ”łļīĆņØæņ╣śņÖĆ ļ¦Øļ¦ēĒśłĻ┤Ćļ░ĆļÅäļŖö ņ£ĀņØśĒĢ£ Ļ┤ĆĻ│äĻ░Ć ņŚåņØīņØä ļ│┤Ļ│ĀĒĢśņśĆļŗż. ļ│Ė ņŚ░ĻĄ¼ņØś ņłĀ ņĀä ĒÅēĻĘĀ ņĢłņČĢņןņØĆ 23.34 ┬▒ 0.73 mm, ĒÅēĻĘĀ ĻĄ¼ļ®┤ļĀīņ”łļīĆņØæņ╣śļŖö 0.38 ┬▒ 2.32 DļĪ£ Ļ│ĀļÅäĻĘ╝ņŗ£ņØś ļ│æņĀüļ│ĆĒÖöĻ░Ć ļ¦Øļ¦ēņØś ĒśłĻ┤Ćļ░ĆļÅäņŚÉ ļ»Ėņ╣śļŖö ņśüĒ¢źņØĆ ļ░░ņĀ£ĒĢśņśĆļŗż. ļ│Ė ņŚ░ĻĄ¼ Ļ▓░Ļ│╝ ĻĄ¼ļ®┤ļĀīņ”łļīĆņØæņ╣śļŖö ļ░▒ļé┤ņןņłśņłĀ Ēøä 6Ļ░£ņøöņŚÉ -0.01 ┬▒ 0.58 DļĪ£ ņ£ĀņØśĒĢśĻ▓ī Ļ░ÉņåīĒĢśņśĆņ£╝ļéś(p=0.021), ļ░▒ļé┤ņןņłśņłĀ 6Ļ░£ņøö ĒøäņØś ĻĄ¼ļ®┤ļĀīņ”łļīĆņØæņ╣śņØś ļ│ĆĒÖöņÖĆ SCPņÖĆ DCPņØś ĒśłĻ┤Ćļ░ĆļÅä ļ│ĆĒÖö ņé¼ņØ┤ņŚÉļŖö ņ£ĀņØśĒĢ£ ņāüĻ┤ĆĻ┤ĆĻ│äĻ░Ć ņŚåņŚłļŗż.
Alaghband et al [24]ņŚÉ ļö░ļź┤ļ®┤ ļ░▒ļé┤ņןņłśņłĀņØĆ ļ░®ņłśņØś ņä¼ņ£ĀņŻ╝ņ£ĀņČ£ļźĀņØä ņ”ØĻ░Ćņŗ£ņ╝£ ņĢłņĢĢņØś Ļ░Éņåīļź╝ ņØ╝ņ£╝Ēé©ļŗżĻ│Ā ĒĢ£ļŗż. Weigert et al [25]ņØĆ ņĢłņĀĆņØś ļ¦źļ░Ģ ņ¦äĒÅŁņØ┤ ņĢłņĢĢ ņ”ØĻ░ĆļĪ£ ņØĖĒĢ┤ Ļ░ÉņåīĒĢ©ņØä ļ│┤Ļ│ĀĒĢśņśĆņ£╝ļ®░, Zhao et al [13]ņØĆ ļ░▒ļé┤ņןņłśņłĀ Ēøä ļ░£ņāØĒĢ£ ņĢłņĢĢĻ░ÉņåīĻ░Ć ĒÖ®ļ░śņØś Ēśłļźś ļ│ĆĒÖöņŚÉ ņśüĒ¢źņØä ļü╝ņ│żņØä Ļ░ĆļŖźņä▒ņØä ņĀ£ņŗ£ĒĢśņśĆļŗż. Zhou et al [14]ņØĆ ļ░▒ļé┤ņןņłśņłĀ Ēøä ņ£ĀņØśĒĢ£ ņĢłņĢĢ Ļ░Éņåīļź╝ ĒÖĢņØĖĒĢśņśĆņ£╝ļéś ĒÖ®ļ░śņØś Ēśłļźś ļ│ĆĒÖöņÖĆ ņāüĻ┤ĆĻ┤ĆĻ│äļŖö ņŚåņŚłņØīņØä ļ│┤Ļ│ĀĒĢśņśĆļŗż. ļ│Ė ņŚ░ĻĄ¼ņŚÉņä£ ļ░▒ļé┤ņןņłśņłĀ Ēøä ĒÅēĻĘĀ ņĢłņĢĢņØĆ ņłĀ ņĀä 14.46 ┬▒ 3.07 mmHgņŚÉņä£ 1ņŻ╝ Ēøä 11.02 ┬▒ 2.89 mmHgņ£╝ļĪ£ ņ£ĀņØśĒĢśĻ▓ī Ļ░ÉņåīĒĢśņśĆĻ│Ā 6Ļ░£ņøö ĒøäņŚÉļÅä 11.68 ┬▒ 3.01 mmHgņ£╝ļĪ£ Ļ░ÉņåīļÉ£ ņ▒ä ņ£Āņ¦ĆļÉśņŚłņØīņØä ĒÖĢņØĖĒĢśņśĆļŗż. ĒĢśņ¦Ćļ¦ī ļ░▒ļé┤ņןņłśņłĀ 6Ļ░£ņøö Ēøä ņĢłņĢĢņØś ļ│ĆĒÖöņÖĆ SCPņÖĆ DCPņØś ĒśłĻ┤Ćļ░ĆļÅä ļ│ĆĒÖö ņé¼ņØ┤ņŚÉļŖö ņ£ĀņØśĒĢ£ ņāüĻ┤ĆĻ┤ĆĻ│äĻ░Ć ņŚåņŚłļŗż.
ĻĘĖ ņÖĖņŚÉļÅä, ļ░▒ļé┤ņןņłśņłĀ Ēøä ņŚ╝ņ”Ø ļ░śņØæņŚÉ ņØśĒĢ£ ņśüĒ¢źņØä ņāØĻ░üĒĢ┤ ļ│╝ ņłś ņ׳ļŗż. ņØ┤ņĀäņØś ņłśņĀĢņ▓┤ ņĀüņČ£ņłĀņØä ņŗ£Ē¢ēĒĢ£ ņźÉ ņŚ░ĻĄ¼ņŚÉņä£ ņłĀ Ēøä interleukin-1├¤, chemokine ligand 2ņÖĆ Ļ░ÖņØĆ ņĀäņŚ╝ņ”Øņä▒ ņ£ĀņĀäņ×ÉņØś ļ░£ĒśäņØ┤ ņ”ØĻ░ĆĒĢ©ņØ┤ ļ│┤Ļ│ĀļÉśņŚłļŗż[26]. ļ░▒ļé┤ņןņłśņłĀ Ēøä ņŚ╝ņ”Ø ļ░śņØæņ£╝ļĪ£ ĒöäļĪ£ņŖżĒāĆĻĖĆļ×ĆļöśņØś ļ░®ņČ£ņØ┤ ņ”ØĻ░ĆĒĢśĻ│Ā ļ░®ņłśņŚÉ ĒöäļĪ£ņŖżĒāĆĻĖĆļ×ĆļöśņØ┤ ļČäļ╣äļÉśļŖöļŹ░, ņØ┤ļĪ£ ņØĖĒĢ┤ ĒśłņĢĪļ¦Øļ¦ēņןļ▓ĮņØ┤ ĒīīĻ┤┤ļÉśļ®┤ ņ£Āļ”¼ņ▓┤Ļ│ĄĻ░ä ļé┤ļĪ£ ņŚ╝ņ”Øļ¼╝ņ¦łņØ┤ ĒŹ╝ņ¦Ćļ®┤ņä£ ļ¦Øļ¦ēņŚÉ ņ×Āņ×¼ņĀüņØĖ ļ│ĆĒÖöļź╝ ņØ╝ņ£╝Ēé¼ ņłś ņ׳Ļ▓ī ļÉ£ļŗżĻ│Ā ņĢīļĀżņĀĖ ņ׳ļŗż[27,28]. ļ░▒ļé┤ņןņłśņłĀ Ēøä ĒÖ®ļ░śļæÉĻ╗śĻ░Ć ņ”ØĻ░ĆĒĢśļŖö Ļ▓āņ£╝ļĪ£ ļ│┤Ļ│ĀļÉśņŚłņ£╝ļ®░, ņłĀ Ēøä ĒĢ®ļ│æņ”Øņ£╝ļĪ£ ļéŁĒżĒÖ®ļ░śļČĆņóģņØ┤ ļ░£ņāØĒĢĀ ņłś ņ׳ļŗż[3,4]. Perente et al [3]ņØĆ ļ░▒ļé┤ņןņłśņłĀ Ēøä 1Ļ░£ņøö, 3Ļ░£ņøö, 6Ļ░£ņøöņŚÉ ņżæņŗ¼ņśżļ¬®, ņżæņŗ¼ņśżļ¬®ļČĆĻĘ╝ņØś ļ¦Øļ¦ēļæÉĻ╗śĻ░Ć ņ£ĀņØśĒĢśĻ▓ī ņ”ØĻ░ĆĒĢśņśĆņØīņØä ļ│┤Ļ│ĀĒĢśņśĆĻ│Ā, Zhao et al [13]ņØĆ ļ░▒ļé┤ņןņłśņłĀ Ēøä 1ņŻ╝, 1Ļ░£ņøö, 3Ļ░£ņøöņŚÉ ņżæņŗ¼ņśżļ¬®, ņżæņŗ¼ņśżļ¬®ļČĆĻĘ╝, ņżæņŗ¼ņśżļ¬®ņŻ╝ņ£ä ļ¦Øļ¦ēļæÉĻ╗śĻ░Ć ņ£ĀņØśĒĢśĻ▓ī ņ”ØĻ░ĆĒĢśņśĆņ£╝ļ®░ ĒŖ╣Ē׳ ļé┤Ļ▓ĮĻ│äļ¦ēĻ│╝ ļé┤ļ¦ØņāüņĖĄ ņé¼ņØ┤ ļæÉĻ╗śĻ░Ć ņ£ĀņØśĒĢśĻ▓ī ņ”ØĻ░ĆĒĢśņśĆņØīņØä ļ│┤Ļ│ĀĒĢśņśĆļŗż. ļ│Ė ņŚ░ĻĄ¼ Ļ▓░Ļ│╝ ņżæņŗ¼ņśżļ¬®, ņżæņŗ¼ņśżļ¬®ļČĆĻĘ╝, ņżæņŗ¼ņśżļ¬®ņŻ╝ņ£ä Ļ░ü ņśüņŚŁļ│ä ĒÅēĻĘĀ ļ¦Øļ¦ēļæÉĻ╗śļŖö ļ░▒ļé┤ņן ņłśņłĀ Ēøä 1ņŻ╝, 1Ļ░£ņøö, 3Ļ░£ņøö, 6Ļ░£ņøöņŚÉ ļ¬©ļæÉ ņ£ĀņØśĒĢśĻ▓ī ņ”ØĻ░ĆĒ¢łļŗż. ĻĘĖļ¤¼ļéś ņØ┤ļ¤¼ĒĢ£ ņ”ØĻ░ĆļŖö ņłśņłĀ Ēøä 1ņŻ╝, 1Ļ░£ņøö, 3Ļ░£ņøöņŚÉ ĒÖ®ļ░ś SCP, DCP ĒśłĻ┤Ćļ░ĆļÅä ņ”ØĻ░ĆņÖĆ Ļ░üĻ░ü ņ£ĀņØśĒĢ£ ņāüĻ┤ĆĻ┤ĆĻ│äĻ░Ć ņŚåņŚłĻ│Ā, 6Ļ░£ņøö Ēøä ņżæņŗ¼ņśżļ¬® DCP ĒśłĻ┤Ćļ░ĆļÅäņÖĆ ņØīņØś ņāüĻ┤ĆĻ┤ĆĻ│äĻ░Ć ņ׳ņŚłņ£╝ļéś, ļŗżņżæĒÜīĻĘĆļČäņäØņŚÉņä£ļŖö ņŚ░Ļ┤Ćņä▒ņØ┤ ņŚåņŚłļŗż. Yu et al [19]ņØĆ ļ░▒ļé┤ņןņłśņłĀ Ēøä ņ”ØĻ░ĆĒĢ£ ņé░ņåīņåīļ╣äļ¤ēņØä ļ│┤ņāüĒĢśĻĖ░ ņ£äĒĢ┤ ļ¦Øļ¦ēĒśłĻ┤ĆņØś ĻĄ¼Ļ▓ĮņØĆ ļ│ĆĒÖöĒĢśņ¦Ć ņĢŖĻ│Ā ņé░ņåīĒżĒÖöļÅäņÖĆ Ēśłļźś ņåŹļÅäĻ░Ć ņ”ØĻ░ĆĒĢśļŖö Ļ▓āņ£╝ļĪ£ ļ│┤ņĢśņ£╝ļ®░, ļĀłņØ┤ņĀĆ ĒöīļĀłņ¢┤ ņĖĪĻ┤æĻ▓Ćņé¼(laser flare photometry) Ļ▓░Ļ│╝ ņłĀ Ēøä ņŚ╝ņ”Øņ£╝ļĪ£ ņØĖĒĢ£ ļ░®ņłśĒØÉļ”╝(flare)ņØĆ ņśżĒ׳ļĀż SQIļź╝ Ļ░Éņåīņŗ£ņ╝£ ĒÖ®ļ░ś ĒśłĻ┤Ćļ░ĆļÅäņÖĆ ņØīņØś ņāüĻ┤ĆĻ┤ĆĻ│äļź╝ ļéśĒāĆļé┤ļŖö Ļ▓āņ£╝ļĪ£ ļ│┤Ļ│ĀĒĢśņśĆļŗż. ļśÉĒĢ£ ņØ┤ļ¤¼ĒĢ£ ņĀäļ░®ņØś ļ░®ņłśĒØÉļ”╝(flare)ņØĆ ĒĢ£ ļŗ¼ ņØ┤ĒøäņŚÉļŖö ļŗżņŗ£ ņłĀ ņĀäĻ│╝ Ļ░ÖņØĆ ņāüĒā£ļĪ£ ļÅīņĢäņśżļŖö Ļ▓āņ£╝ļĪ£ ļ│┤Ļ│ĀļÉśņŚłļŗż[29]. ļö░ļØ╝ņä£ ļ░▒ļé┤ņןņłśņłĀ Ēøä ņŚ╝ņ”Ø ļ░śņØæņØĆ ņłśņłĀ Ēøä ĒÖ®ļ░ś ļ¬©ņäĖĒśłĻ┤Ćņ┤Ø ĒśłĻ┤Ćļ░ĆļÅä ņ”ØĻ░ĆņÖĆ Ļ┤ĆļĀ©ņØ┤ ņŚåņØä Ļ▓āņ£╝ļĪ£ ņāØĻ░üļÉ£ļŗż.
ļ¦łņ¦Ćļ¦ēņ£╝ļĪ£ ļ░▒ļé┤ņןņłśņłĀ Ēøä ļ¦Øļ¦ēņŚÉ ļ»Ėņ╣śļŖö ļ╣ø ļÅģņä▒ņØś ņ”ØĻ░ĆļĪ£ ņØĖĒĢ£ ņןĻĖ░ņĀüņØĖ ņśüĒ¢źņØä Ļ│ĀļĀżĒĢ┤ļ│╝ ņłś ņ׳ļŖöļŹ░, ļ░▒ļé┤ņןņØĆ ļ¦Øļ¦ēņ£╝ļĪ£ Ļ░ĆļŖö ļ╣øņØś 18-40%ļź╝ ņ░©ļŗ©ĒĢśļ®░ ļ░▒ļé┤ņןņłśņłĀņØä ĒĢśļ®┤ ļ¦Øļ¦ēņŚÉ ļÅäļŗ¼ĒĢśļŖö ļ╣øņØ┤ ņ”ØĻ░ĆĒĢ£ļŗż[30]. ņØ┤ņĀä ņŚ░ĻĄ¼ņŚÉ ļö░ļź┤ļ®┤ ļ╣ø ļÅģņä▒ņØĆ ļ¦Øļ¦ēņØś ļīĆņé¼ļź╝ ĒÖ£ņä▒ĒÖöņŗ£ĒéżĻ│Ā ĒśłĻ┤ĆņŗĀņāØņØä ņ┤ēņ¦äĒĢśļ®░, ņŚ░ļĀ╣Ļ┤ĆļĀ©ĒÖ®ļ░śļ│Ćņä▒ņØś ļ░£ņāØļźĀ ņ”ØĻ░ĆņÖĆļÅä Ļ┤ĆļĀ©ņØ┤ ņ׳ļŗżĻ│Ā ļ│┤Ļ│ĀļÉśņŚłļŗż[31,32]. ļ░▒ļé┤ņןņłśņłĀ Ēøä ņ”ØĻ░ĆļÉ£ ļ╣ø ļÅģņä▒ņØĆ ļ¦Øļ¦ēņØś ĒśłļźśņŚÉ ņןĻĖ░ņĀüņ£╝ļĪ£ ņśüĒ¢źņØä ļü╝ņ╣Ā Ļ▓āņ£╝ļĪ£ ņāØĻ░üļÉśļéś ņØ┤ņŚÉ ļīĆĒĢ£ ņŚ░ĻĄ¼ļŖö ĒĢśņ¦Ć ļ¬╗ĒĢśņśĆņ£╝ļ®░ ņČöĻ░ĆņĀüņØĖ ņŚ░ĻĄ¼Ļ░Ć ĒĢäņÜöĒĢśļŗż.
ņŗ£ņŗĀĻ▓Įņ£ĀļæÉļé┤ ļ░Å ņŗ£ņŗĀĻ▓Įņ£ĀļæÉņŻ╝ņ£ä ĒśłĻ┤Ćļ░ĆļÅäļŖö ĒÖ®ļ░ś ļ¬©ņäĖĒśłĻ┤Ćņ┤Ø ĒśłĻ┤Ćļ░ĆļÅäņÖĆ ļŗ¼ļ”¼ ņ£ĀņØśļ»ĖĒĢ£ ļ│ĆĒÖöļź╝ ļ│┤ņØ┤ņ¦Ć ņĢŖņĢśļŖöļŹ░ ņØ┤ļŖö RPCņÖĆ ĒÖ®ļ░ś ļ¬©ņäĖĒśłĻ┤Ćņ┤ØņØś ĒĢ┤ļČĆĒĢÖņĀü ņ░©ņØ┤ņÖĆ ļ╣øĻ░äņäŁļŗ©ņĖĄĒśłĻ┤ĆņĪ░ņśüņłĀņŚÉ ņØśĒĢ£ ņŗ£ņŗĀĻ▓Įņ£ĀļæÉņśüņŚŁ ĒśłĻ┤Ćļ░ĆļÅä ņĖĪņĀĢņØś ļé«ņØĆ ņ×¼Ēśäņä▒ņŚÉ ĻĖ░ņØĖĒĢ£ Ļ▓āņ£╝ļĪ£ ņČöņĀĢļÉ£ļŗż. RPCļŖö ĒśłĻ┤Ć ļ¬©ņ¢æņØ┤ Ļ│¦Ļ│Ā ĻĖĖļ®░ ļ¼ĖĒĢ®ņØ┤ ļō£ļ¼╝Ļ│Ā ļ¦Øļ¦ēņŗĀĻ▓Įņä¼ņ£ĀņĖĄņŚÉ ņ£äņ╣śĒĢ£ļŗż[33]. ņØ┤ļ¤░ ĒĢ┤ļČĆĒĢÖņĀü ĒŖ╣ņ¦Ģņ£╝ļĪ£ ļ╣øĻ░äņäŁļŗ©ņĖĄĒśłĻ┤ĆņĪ░ņśüņłĀļĪ£ ņĖĪņĀĢļÉ£ ņŗ£ņŗĀĻ▓Įņ£ĀļæÉņśüņŚŁņØś ĒśłĻ┤Ćļ░ĆļÅäļŖö ļ░▒ļé┤ņןņłśņłĀ Ēøä SQI ļ│ĆĒÖöņŚÉ ņśüĒ¢źņØä ļŹ£ ļ░øņĢśņØä Ļ░ĆļŖźņä▒ņØ┤ ņ׳ļŗż. Lim et al [34]ņØś ņŚ░ĻĄ¼ Ļ▓░Ļ│╝, ļ╣øĻ░äņäŁļŗ©ņĖĄĒśłĻ┤ĆņĪ░ņśüņłĀņŚÉ ņØśĒĢ£ ņŗ£ņŗĀĻ▓Įņ£ĀļæÉņśüņŚŁ ĒśłĻ┤Ćļ░ĆļÅä ņĖĪņĀĢņØĆ ĒÖ®ļ░ś ļ¬©ņäĖĒśłĻ┤Ćņ┤Ø ĒśłĻ┤Ćļ░ĆļÅä ņĖĪņĀĢņŚÉ ļ╣äĒĢ┤ ņ×¼Ēśäņä▒ņØ┤ ļé«ļŗżĻ│Ā ļ│┤Ļ│ĀĒĢśņśĆļŖöļŹ░, ņØ┤ļĪ£ ņØĖĒĢ┤ ļ░▒ļé┤ņןņłśņłĀ Ēøä ĒśłĻ┤Ćļ░ĆļÅä ļ│ĆĒÖöĻ░Ć Ļ┤Ćņ░░ļÉśņ¦Ć ņĢŖņĢśņØä Ļ░ĆļŖźņä▒ņØ┤ ņ׳ļŗż. ĒĢśņ¦Ćļ¦ī ļ│Ė ņŚ░ĻĄ¼ļŖö ņĀüņØĆ ņłśņØś ĒÖśņ×ÉĻĄ░ņØä ļīĆņāüņ£╝ļĪ£ ĒøäĒ¢źņĀüņ£╝ļĪ£ ņŗżņŗ£ĒĢśņśĆļŗżļŖö ĒĢ£Ļ│äĻ░Ć ņ׳ņ¢┤ ļ░▒ļé┤ņןņłśņłĀ Ēøä ņŗ£ņŗĀĻ▓Įņ£ĀļæÉļé┤ ļ░Å ņŗ£ņŗĀĻ▓Įņ£ĀļæÉņŻ╝ņ£ä ĒśłĻ┤Ćļ░ĆļÅä ļ│ĆĒÖöļŖö Ē¢źĒøä ļŹö ļ¦ÄņØĆ ņłśņØś ĒÖśņ×ÉĻĄ░ņØä ļīĆņāüņ£╝ļĪ£ ĒĢ£ ņČöĻ░ĆņĀüņØĖ ņŚ░ĻĄ¼Ļ░Ć ĒĢäņÜöĒĢśļŗż.
ļ░▒ļé┤ņןņłśņłĀ Ēøä ņĄ£ļīĆĻĄÉņĀĢņŗ£ļĀźņØĆ ņłĀ ņĀä ĒÅēĻĘĀ 0.35 ┬▒ 0.13 logMARņŚÉņä£ ņłĀ Ēøä 6Ļ░£ņøöņŚÉ 0.16 ┬▒ 0.14 logMARļĪ£ ņ£ĀņØśĒĢśĻ▓ī ņ”ØĻ░ĆĒĢśņśĆņ£╝ļéś, ņĄ£ļīĆĻĄÉņĀĢņŗ£ļĀź ļ│ĆĒÖöņÖĆ ĒÖ®ļ░ś SCPņÖĆ DCPņØś ĒśłĻ┤Ćļ░ĆļÅä ņ”ØĻ░ĆļŖö ņ£ĀņØśĒĢ£ ņāüĻ┤ĆĻ┤ĆĻ│äĻ░Ć ņŚåņŚłļŗż. ļö░ļØ╝ņä£ ļ░▒ļé┤ņןņłśņłĀ Ēøä ĒÖ®ļ░ś ļ¬©ņäĖĒśłĻ┤Ćņ┤Ø ĒśłĻ┤Ćļ░ĆļÅä ņ”ØĻ░ĆĻ░Ć ņłśņłĀ Ēøä ņŗ£ļĀź ĒśĖņĀäņŚÉļŖö ņśüĒ¢źņØä ņŻ╝ņ¦Ć ņĢŖņĢśļŗż.
ļ│Ė ņŚ░ĻĄ¼ Ļ▓░Ļ│╝ ļ░▒ļé┤ņןņłśņłĀ Ēøä ĒÖ®ļ░ś SCPņÖĆ DCPņØś ĒśłĻ┤Ćļ░ĆļÅäĻ░Ć ņżæņŗ¼ņśżļ¬®, ņżæņŗ¼ņśżļ¬®ļČĆĻĘ╝, ņżæņŗ¼ņśżļ¬®ņŻ╝ņ£äņŚÉņä£ ļ¬©ļæÉ ņ£ĀņØśĒĢśĻ▓ī ņ”ØĻ░ĆĒĢśņśĆņ£╝ļ®░, ņØ┤ļ¤¼ĒĢ£ ļ│ĆĒÖöļŖö 6Ļ░£ņøö ĒøäņŚÉļÅä ņ£Āņ¦ĆļÉśņŚłļŗż. ņŗ£ņŗĀĻ▓Įņ£ĀļæÉļé┤ ļ░Å ņŗ£ņŗĀĻ▓Įņ£ĀļæÉņŻ╝ņ£ä ĒśłĻ┤Ćļ░ĆļÅäņÖĆ FAZ ļ®┤ņĀüņØĆ ļ░▒ļé┤ņןņłśņłĀ Ēøä ņ£ĀņØśĒĢ£ ļ│ĆĒÖöĻ░Ć Ļ┤Ćņ░░ļÉśņ¦Ć ņĢŖņĢśļŗż. ļ░▒ļé┤ņןņłśņłĀ Ēøä ņłśņĀĢņ▓┤Ēś╝ĒāüņØś ņĀ£Ļ▒░ņŚÉ ļö░ļźĖ SQI ņ”ØĻ░ĆļŖö ņłĀ Ēøä ņĖĪņĀĢļÉ£ ĒÖ®ļ░ś ļ¬©ņäĖĒśłĻ┤Ćņ┤Ø ĒśłĻ┤Ćļ░ĆļÅäņØś ņ”ØĻ░ĆņŚÉ ņ£ĀņØśĒĢ£ ņśüĒ¢źņØä ļ»Ėņ│żņØä Ļ▓āņ£╝ļĪ£ ņāØĻ░üļÉśļ®░, ļ░▒ļé┤ņןņłśņłĀ ņĀäĒøä ļ╣øĻ░äņäŁĒśłĻ┤ĆņĪ░ņśüņłĀ ņ┤¼ņśü ņŗ£ ņØ┤ļź╝ Ļ│ĀļĀżĒĢ┤ņĢ╝ ĒĢĀ Ļ▓āņØ┤ļŗż.
ļ│Ė ņŚ░ĻĄ¼ņØś ĒĢ£Ļ│äņĀÉņ£╝ļĪ£ ļ╣øĻ░äņäŁļŗ©ņĖĄĒśłĻ┤ĆņĪ░ņśüņłĀ Ļ▓Ćņé¼ ņŗ£ņŚÉ Ēł¼ņé¼ ĒÜ©Ļ│╝(projection artifact)ņŚÉ ņØśĒĢ┤ SCPņØś ĒśłĻ┤ĆņØ┤ DCPņŚÉ ļ╣äņ│ÉņĀĖ FAZņØś ņĀĢĒÖĢĒĢ£ ļ®┤ņĀüņØä ĻĄ¼ĒĢśĻ│Ā ĒÖ®ļ░śņØś ļ»ĖņäĖĒśłĻ┤Ć ļ│ĆĒÖöļź╝ Ļ░Éņ¦ĆĒĢśļŖö ļŹ░ņŚÉ ņśüĒ¢źņØä ļü╝ņ│żņØä Ļ▓āņ£╝ļĪ£ ņāØĻ░üļÉśļ®░, Ē¢źĒøä Ēł¼ņé¼ ĒÜ©Ļ│╝ļź╝ ļ░░ņĀ£ĒĢĀ ņłś ņ׳ļŖö ĻĖ░ņłĀņĀü ļ░£ņĀäņØ┤ ĒĢäņÜöĒĢĀ Ļ▓āņ£╝ļĪ£ ļ│┤ņØĖļŗż[35]. ļśÉĒĢ£ ļ╣øĻ░äņäŁļŗ©ņĖĄĒśłĻ┤ĆņĪ░ņśüņłĀņØä ņØ┤ņÜ®ĒĢ£ ĒśłĻ┤Ćļ░ĆļÅä ņĖĪņĀĢņØś ņ×¼Ēśäņä▒ņØä ņŚ░ĻĄ¼ĒĢ£ Ļ▓░Ļ│╝ņŚÉ ļö░ļź┤ļ®┤, ņØ╝ņżæ ļ│ĆļÅÖņ£╝ļĪ£ ņĖĪņĀĢ ņŗ£Ļ░äņŚÉ ļö░ļØ╝ SCPņÖĆ DCPņØś ĒśłĻ┤Ćļ░ĆļÅä ļ¬©ļæÉ Ļ░üĻ░ü ņĄ£ļīĆ 8%, 10%ņØś ņ░©ņØ┤ļź╝ ļ│┤ņØ╝ ņłś ņ׳ļŗżĻ│Ā ĒĢśņśĆļŖöļŹ░ ņØ┤ ņĀÉņŚÉ ļīĆĒĢ┤ņä£ Ļ│ĀļĀżĒĢśņ¦Ć ļ¬╗ĒĢśņśĆļŗż[36]. ļśÉĒĢ£ ņ¦äĒ¢ēļÉ£ ļ░▒ļé┤ņןņØ╝ņłśļĪØ ņłĀ ĒøäņŚ╝ņ”Ø ļ░śņØæņØ┤ ņŗ¼ĒĢśĻ│Ā ņłśņłĀ ņĀäĒøä SQI ļ│ĆĒÖöĻ░Ć ņ╗żņä£ ĒśłĻ┤Ćļ░ĆļÅäļ│ĆĒÖöĻ░Ć Ēü┤ Ļ▓āņ£╝ļĪ£ ņāØĻ░üĒĢśņśĆņ£╝ļéś, ļ░▒ļé┤ņן ņ¦äĒ¢ē ņĀĢļÅäļŖö ĒøäļéŁĒĢśļ░▒ļé┤ņןĻ│╝ ņłśņłĀ 1ņŻ╝ Ēøä ņżæņŗ¼ņśżļ¬®ļČĆĻĘ╝ DCP, ņżæņŗ¼ņśżļ¬®ņŻ╝ņ£ä DCPņØś ĒśłĻ┤Ćļ░ĆļÅä ļ│ĆĒÖö, Ēö╝ņ¦łļ░▒ļé┤ņןĻ│╝ 3Ļ░£ņøö Ēøä ņżæņŗ¼ņśżļ¬® SCPņØś ĒśłĻ┤Ćļ░ĆļÅä ļ│ĆĒÖö ņé¼ņØ┤ņŚÉ ņ£ĀņØśĒĢ£ ņāüĻ┤ĆĻ┤ĆĻ│äĻ░Ć ņ׳ņŚłļŹś Ļ▓ā ņÖĖņŚÉ ļéśļ©Ėņ¦Ć ņśüņŚŁņŚÉņä£ļŖö 1ņŻ╝, 1Ļ░£ņøö, 3Ļ░£ņøö, 6Ļ░£ņøöņŚÉ ĒśłĻ┤Ćļ░ĆļÅä ļ│ĆĒÖöļ¤ēĻ│╝ ļ¬©ļæÉ ņ£ĀņØśĒĢ£ ņāüĻ┤ĆĻ┤ĆĻ│äĻ░Ć ņŚåņ¢┤ Yu et al [19]ņØś ņŚ░ĻĄ¼ Ļ▓░Ļ│╝ņÖĆļŖö ļŗżļź┤Ļ▓ī ļéśĒāĆļé¼ļŗż. ņØ┤ļŖö LOCS III ļČäļźśņāü ĒÅēĻĘĀ Ēö╝ņ¦łļ░▒ļé┤ņן 3, ĒĢĄļ░▒ļé┤ņן 4, ĒøäļéŁĒĢśļ░▒ļé┤ņן 4ņØś ĒÖśņ×Éļź╝ ļīĆņāüņ£╝ļĪ£ ĒĢ£ Yu et al [19]Ļ│╝ļŖö ļŗ¼ļ”¼ ļ│ĖņøÉņØś ņŚ░ĻĄ¼ņŚÉņä£ļŖö SQIĻ░Ć 4 ļ»Ėļ¦īņØĖ ĒÖśņ×ÉļŖö ņŚ░ĻĄ¼ ļīĆņāüņŚÉņä£ ņĀ£ņÖĖĒĢ©ņŚÉ ļö░ļØ╝ LOCS III ļČäļźśņāü ĒÅēĻĘĀ Ēö╝ņ¦łļ░▒ļé┤ņן 1.96 ┬▒ 1.33, ĒĢĄļ░▒ļé┤ņן 2.27 ┬▒ 1.32, ĒøäļéŁĒĢśļ░▒ļé┤ņן 0.33 ┬▒ 0.76ņ£╝ļĪ£ ņāüļīĆņĀüņ£╝ļĪ£ Ļ▓ĮĒĢ£ ĒÖśņ×ÉĻĄ░ņØä ļīĆņāüņ£╝ļĪ£ ņŚ░ĻĄ¼ĒĢ©ņŚÉ ļö░ļØ╝ Ēæ£ļ│ĖņäĀņĀĢĒÄĖĒīīņØś ņśüĒ¢źņØ┤ ņ׳ņŚłņØä Ļ▓āņ£╝ļĪ£ ļ│┤ņØĖļŗż. ĻĘĖļ”¼Ļ│Ā Ēøäļ░£ ļ░▒ļé┤ņןņØĆ SQIņŚÉ ņśüĒ¢źņØä ļ»Ėņ│É ĒÖ®ļ░ś ĒśłĻ┤Ćļ░ĆļÅä ņĖĪņĀĢņŚÉ ņśüĒ¢źņØä ņżä Ļ▓āņ£╝ļĪ£ ņāØĻ░üļÉśļéś ļ│Ė ņŚ░ĻĄ¼ļŖö ņØśļ¼┤ĻĖ░ļĪØņØä ĒåĄĒĢ£ ĒøäĒ¢źņĀü ņŚ░ĻĄ¼ļĪ£ Ēøäļ░£ļ░▒ļé┤ņן ņĀĢļÅäņŚÉ ļīĆĒĢ£ ĻĖ░ņłĀņØ┤ ņŚåļŖö ĒÖśņ×ÉĻ░Ć ļīĆļČĆļČäņØ┤ņ¢┤ņä£ ņØ┤ņŚÉ ļīĆĒĢ£ ļČäņäØņØĆ ņŗ£Ē¢ēĒĢśņ¦Ć ļ¬╗ĒĢśņśĆļŗż. ļ░▒ļé┤ņןņłśņłĀ Ēøä 6Ļ░£ņøöņØś ĻĖ░Ļ░ä ļÅÖņĢł Ēøäļ░£ļ░▒ļé┤ņןņ£╝ļĪ£ ņĢ╝ĻĘĖļĀłņØ┤ņĀĆĒøäļéŁņĀłĻ░£ņłĀņØä ņŗ£Ē¢ēĒĢ£ ņé¼ļĪĆļŖö ņŚåņŚłļŖöļŹ░, Ē¢źĒøä ņĢ╝ĻĘĖļĀłņØ┤ņĀĆĒøäļéŁņĀłĻ░£ņłĀ ņĀäĒøä ĒÖ®ļ░ś ļ¬©ņäĖĒśłĻ┤Ćņ┤Ø ĒśłĻ┤Ć ļ░ĆļÅä ļ│ĆĒÖöņŚÉ ļīĆĒĢ£ ņČöĻ░ĆņĀüņØĖ ņŚ░ĻĄ¼Ļ░Ć ĒĢäņÜöĒĢśļŗż.
Ļ▓░ļĪĀņĀüņ£╝ļĪ£ ļ│Ė ņŚ░ĻĄ¼ļŖö ļ╣øĻ░äņäŁļŗ©ņĖĄĒśłĻ┤ĆņĪ░ņśüņłĀņØä ņØ┤ņÜ®ĒĢśņŚ¼ ļ░▒ļé┤ņןņłśņłĀ Ēøä ĒÖ®ļ░śņØś SCPņÖĆ DCPņØś ĒśłĻ┤Ćļ░ĆļÅä, ņŗ£ņŗĀĻ▓Įņ£ĀļæÉļé┤ņÖĆ ņŗ£ņŗĀĻ▓Įņ£ĀļæÉņŻ╝ņ£ä ĒśłĻ┤Ćļ░ĆļÅä, FAZ ļ®┤ņĀüņØś ļ│ĆĒÖöļź╝ Ļ░üĻ░ü ņĀĢļ¤ēņĀüņ£╝ļĪ£ ļČäņäØĒĢśņśĆļŗż. ĻĘĖ Ļ▓░Ļ│╝ ņŗ£ņŗĀĻ▓Įņ£ĀļæÉļé┤, ņŗ£ņŗĀĻ▓Įņ£ĀļæÉņŻ╝ņ£ä ĒśłĻ┤Ćļ░ĆļÅäņÖĆ FAZ ļ®┤ņĀüņØĆ ņ£ĀņØśĒĢ£ ļ│ĆĒÖöĻ░Ć ļéśĒāĆļéśņ¦Ć ņĢŖņĢśņ£╝ļ®░ ĒÖ®ļ░ś SCPņÖĆ DCPņØś ĒśłĻ┤Ćļ░ĆļÅäļŖö ņżæņŗ¼ņśżļ¬®, ņżæņŗ¼ņśżļ¬®ļČĆĻĘ╝, ņżæņŗ¼ņśżļ¬®ņŻ╝ņ£ä ņäĖ ņśüņŚŁņŚÉņä£ ļ░▒ļé┤ņןņłśņłĀ 1ņŻ╝ Ēøä, 1Ļ░£ņøö Ēøä, 3Ļ░£ņøö Ēøä, 6Ļ░£ņøö ĒøäņŚÉ ļ¬©ļæÉ ņ£ĀņØśĒĢśĻ▓ī ņ”ØĻ░ĆļÉśņŚłņØīņØä ĒÖĢņØĖĒĢĀ ņłś ņ׳ņŚłļŗż.


 PDF Links
 PubReader
 ePub Link
 Full text via DOI
 Download Citation
 Print
Print