초음파수정체유화술을 이용한 백내장수술은 안과에서 매우 흔하게 이루어지는 수술이다[
1]. 맥락막은 결체조직, 신경과 멜라닌세포뿐아니라 망막 외층에 영양과 산소를 공급하는 풍부한 혈관으로 이루어져 있다[
2,
3]. 최근 enhanced depth imaging (EDI) optical coherence tomography (OCT)을 이용하여 맥락막의 기질과 혈관층에 대한 관찰이 가능해지면서 맥락막의 변화에 대한 다양한 연구가 진행되고 있다[
4,
5]. 특히, 안과에서 가장 흔하게 시행되는 백내장수술 후에 중심와아래 맥락막두께 및 맥락막혈관 지수에 대해 다양한 연구들이 있다[
1,
6-
12]. 어떤 연구에서는 백내장수술 후 중심와아래 맥락막두께와 맥락막혈관 지수가 증가한다는 결과가 있다[
1,
6,
8,
11,
12]. 그러나 일부에서는 변화가 없다는 상반된 결과가 있어 아직까지 정립된 결과는 없다[
7,
9,
10]. 또한, 백내장수술 후 중심와아래 맥락막두께와 맥락막혈관 지수의 변화에 대한 요인들에 관한 연구는 아직까지 보고된 바가 없다. 이에 본 저자들은 백내장수술 전 마취 방법, 고혈압과 당뇨, 그리고 수술 중 사용한 초음파의 세기와 시간 같은 임상적 요인들이 백내장수술 후에 중심와아래 맥락막의 두께와 혈관 지수에 미치는 영향에 대해 알아보고자 한다.
대상과 방법
본 저자들은 2019년 1월부터 2019년 11월까지 가톨릭대학교 부천성모병원에서 합병증 없는 단순 백내장에 대해 초음파수정체유화술 및 후방내 인공수정체삽입술을 시행받은 환자를 대상으로 후향적으로 의무기록을 조사하였다. 본 연구는 환자의 연구 동의를 면제받았으며, 가톨릭대학교 부천성모병원 임상연구심의위원회(Insititutional Review Board, IRB)의 승인을 받아 진행되었다(IRB 승인 번호: HC20RASI0089). 모든 과정은 헬싱키선언(Declaration of Helsinki)을 준수하였다.
백내장수술은 5년 이상의 수술 경험을 가진 숙련된 술자 2인에 의해 시행되었다. 백내장수술에 이용된 인공수정체는 모두 Tecnis 1-Piece aspheric acrylic posterior chamber intraocular lens (ZCB00®; Johnson & Johnson, Inc. Santa, CA, USA)를 사용하였다. 수술 전후와 수술 도중에 특별한 합병증은 발생하지 않았다. 수술 시간은 대략 15-20분가량 소요되었다. 수술 전 마취는 점안마취 혹은 구후마취를 시행하였다. 점안마취는 Proparacaine hydrochloride 0.5% (Alcaine®; Novartis, Basel, Switzerland)를 수술 직전 2-5방울 수술안에 점안하였다. 구후마취는 Lidocaine hydrochloride 2% (Lidocaine®; Huons. Co. Ltd., Seongnam, Korea)와 Bupivacaine Hydrochloride 0.5% (Pucaine®; REYON Pharmaceutical Co., Ltd., Seoul, Korea)를 7:3 비로 혼합하여 1.5-2 mL 가량을 구후에 주입한 후, 10-15분가량 눈을 압박하였다. 각막절개도 2.75 mm (Clear cut®; Alcon, Fort Worth, TX, USA)를 사용하여 투명각막절개를 시행하였다. 점탄물질로 Hyaluronic acid 1.5% (Hyalu®; Hanmi Pharm Co. Ltd., Seoul, Korea)를 전방에 주입하고 원형전낭절개를 시행하였다. 평형염액(BSS®, Alcon, Fort Worth, TX, USA)을 사용하여 수력분리술과 수력분층술을 하였다. 수정체유화술 기계(Infiniti®; Alcon, Fort Worth, TX, USA)를 이용하여 수정체낭 내의 수정체를 유화하고, 잔류피질은 관류흡입기로 제거하였다. 인공수정체를 카트리지와 주입기에 장착하고 수정체낭 내에 삽입하였다. 수술 후 1달간 0.5% Moxifloxacin hydrochloride (Vigamox®; Novartis, Basel, Switzerland)와 Prednisolone acetate 1% (Predforte®; Allercan, Inc., Chicago, IL, USA)를 각각 4회/일 수술안에 점안하였다.
환자의 맥락막은 수술 전, 수술 1주 후, 1달 후 그리고 2달 후의 EDI-OCT 촬영법(Cirrus HD‑OCT 4000
®; Carl Zeiss Meditec AG, Inc., Dublin, CA, USA)4,5,13을 이용하여 검사하였다. 선택된 이미지는 ImageJ 소프트웨어(
http://imagej.nih.gov/ij, version2.0.0-rc-69/1.52, National Institute of Health, Bethesda, MD, USA)를 이용하여 이진화(Binarizaion)하였다(
Fig. 1) [
14-
17]. 맥락막의 범위는 OCT 중 시신경유두와 황반오목을 가로지르는 단면에서 망막색소상피의 바깥쪽 경계에서 공막의 안쪽 경계로 하였다[
2]. OCT 단면의 맥락막 범위 내에서 중심와아래 맥락막두께(subfoveal choroidal thickness), 맥락막혈관내경 넓이(luminal area), 전체 맥락막 넓이(total choroidal area) 및 맥락막혈관지수(choroidal vascularity index)를 측정하였다(
Fig. 1A) [
14-
17]. 선택된 OCT 단면을 ImageJ의 Polygon tool을 이용하여 전체 맥락막 넓이를 선택하였다(
Fig. 1B). 명암을 조정하여 region of interest (ROI) manager에 입력하였고, 이미지를 8 bit로 변환하여 Niblack’s auto local threshold로 이진화화였다(
Fig. 1C). 이진화된 이미지는 RGB 이미지로 다시 변환하여 Threshold color tool로 어두운 픽셀을 ROI manager에 저장하였다(
Fig. 1D). ROI manager에 입력된 총 2가지 이미지를 AND operation하여 맥락막혈관내경 넓이를 구하였다(
Fig. 1D). 맥락막혈관 지수는 맥락막혈관내경 넓이와 전체 맥락막 넓이의 비로 구하였다(
Fig. 1E). 같은 방법으로 95안의 모든 이미지를 계산하였다.
초음파의 세기와 시간은 수술 후 수정체유화술 기계(Infiniti®, Alcon)에서 제공된 정보를 이용하였다. 초음파의 세기는 화면에 제공된 equivalent average ultrasonic power 값을 이용하였다. 초음파의 시간은 기계의 화면에 total longitudinal power on time을 사용하였다.
통계적 분석은 SPSS version 23.0 (IBM Inc., Armonk, NY, USA) 소프트웨어를 이용하였다. 모든 측정치의 평균값을 각각의 분석에 활용하였다. 수술 전후 중심와아래 맥락막두께와 맥락막혈관 지수의 측정치를 비교하기 위해 마취 방법, 당뇨의 유무, 그리고 고혈압의 유무에 따라 대응표본 t-검정을 시행하였다. 시간에 흐름에 따른 각 변수(마취 방법, 당뇨의 유무, 그리고 고혈압의 유무)에 따라 중심와아래 맥락막두께와 맥락막혈관 지수의 변화에 차이가 있는지를 그룹별로 비교하기 위해 Boferroni법을 이용한 반복 측정 분산분석(repeated measures analysis of variance)을 사용하였다. 중심와아래 맥락막두께와 맥락막혈관 지수가 수술 중 사용한 초음파의 세기와 시간과 어떤 상관관계를 갖는지 확인하기 위해 Pearson 상관계수를 이용하였다. 모든 경우에서 p-value가 0.05미만인 경우 통계적으로 유의하다 해석하였다.
결 과
총 62명의 95안이 연구에 포함되었다. 남자 환자 30명의 48안, 여자 환자 32명의 47안이었다(
Table 1). 양안은 33안을 조사하였다(
Table 1). 평균 연령은 68.0 ± 10.0세(46-87세)였다(
Table 1). 이 중 25안(26.3%)은 점안마취, 42안(44.2%)은 구후마취를 시행하였고, 나머지 28안(29.5%)은 같은 기간 수술을 시행하지 않은 반대안의 기록을 확인하였다(
Table 1). 수술을 시행한 67안 중 기저질환으로 당뇨가 있는 경우는 31안(46.3%)이었고, 고혈압이 있는 경우는 42안(62.7%)이었다(
Table 1). 교차분석을 시행하여 마취 방법, 당뇨와 고혈압의 유무 간에 연관성을 확인하였을 때, 서로 유의한 연관성을 보인 것은 없었다(
Table 2).
중심와아래 맥락막두께의 시간에 따른 변화는 수술한 전체 눈에서 수술 전 269.55 ± 42.86 μm, 수술 1주 후 328.48 ± 58.24 μm (
p<0.001), 1달 후 324.24 ± 69.83 μm (
p<0.001), 2달 후 313.31 ± 69.91 μm (
p<0.001)로 수술 1주 후에 증가한 이후 유의하게 감소하는 결과를 결과를 보였다(
Table 3,
Fig. 2A). 환자군을 마취 방법, 고혈압 유무에 따라 나누었을 때는 각 군 내에서 요인에 따른 차이가 유의하지 않았지만(
Fig. 2B,
D, 각각
p=0.421,
p=0.281), 당뇨 유무에 따라 나 누었을 때에는 그 변화 양상이 당뇨 유무에 따라 차이를 보였다(
Fig. 2C,
p=0.037). 당뇨가 없는 군에서는 맥락막두께의 변화가 당뇨가 있는 군에서 보다 유의하게 적게 관찰되었다(
Fig. 2C).
평균 맥락막혈관 지수는 수술한 전체 눈에서 수술 전 59.82 ± 2.11%, 수술 1주 후 62.05 ± 1.79% (
p<0.001), 1달 후 62.56 ± 1.95% (
p<0.001), 2달 후 62.63 ± 2.28% (
p<0.001)로 수술 후 증가하는 양상을 보였다(
Table 4,
Fig. 3A). 수술을 시행하지 않은 반대안의 맥락막혈관 지수의 수술 후 1주 후, 1달 후 그리고 2달 후의 변화는 통계적으로 모두 유의하지 않았다(
Table 4, 각각
p=0.95,
p=0.89,
p=0.94) 마취 방법에 따라 수술 1주 후, 1달 후 그리고 2달 후의 수술 전과 비교하여 점안마취군에서 2.49 ± 2.58%, 3.21 ± 2.55%, 2.83 ± 3.05%로 수술 1달 후에 비해 2달 후에 감소하는 유의한 변화를 보였으나(
Table 4,
Fig. 3B,
p<0.001), 점안마취와 구후마취를 시행한 환자 간에 맥락막혈관 지수 변화 양상의 차이는 통계적으로 유의하지 않았다(
Fig. 3B,
p=0.409). 당뇨나 고혈압이 없는 환자군에서 맥락막혈관 지수는 수술 1달 후에 비해 2달 후에 감소하는 유의한 변화를 보였으나(
Table 4,
Fig. 3C,
D,
p<0.001), 당뇨나 고혈압이 있는 환자군과 비교하여 맥락막혈관 지수 변화 양상의 차이는 통계적으로 유의하지 않았다(
Fig. 3D, 각각
p=0.682,
p=0.10).
초음파의 세기와 수술 1주 후 중심와아래 맥락막두께 변화의 Pearson 상관계수는 0.208로 유의하지 않았으며(
Fig. 4A,
p=0.090), 초음파의 시간과 수술 1주 후 중심와아래 맥락막두께 변화의 Pearson 상관계수는 0.049로 유의하지 않았다(
Fig. 4B,
p=0.695). 초음파의 세기와 수술 1주 후 맥락막혈관 지수 변화의 Pearson 상관계수는 -0.003로 유의하지 않았으며(
Fig. 4C,
p=0.982), 초음파의 시간과 수술 1주 후 맥락막혈관 지수의 Pearson 상관계수는 0.011로 유의하지 않았다(
Fig. 4D,
p=0.930).
고 찰
맥락막은 결체조직, 신경, 멜라닌세포과 혈관들로 이루어진 조직으로 망막에 영양과 산소를 공급할 뿐 아니라 안구의 대사와 온도를 조절해주는 중요한 역할을 한다[
2,
3,
8,
18]. 맥락막의 변화는 연령관련황반변성, 당뇨망막병증, 망막부종 그리고 중심장액맥락망막병증 등과 같은 여러 망막질환들과 관련이 있다[
1,
8]. 최근 EDI-OCT의 발전 덕분에 백내장수술 후 중심와아래 맥락막두께 및 맥락막혈관 지수에 대해서도 연구들이 진행되고 있다[
1,
3,
6-
12]. 하지만 보고되는 결과들에 차이가 있다. Chen et al [
1]은 백내장수술 후 중심와아래 맥락막두께와 맥락막혈관 지수가 수술 후 3달까지 지속적으로 유의하게 증가한다고 보고하였으며, Ohsugi et al [
3]은 수술 직후부터 1주까지 증가하다 이후 다시 감소한다고 하였다. 한편, Falcão et al [
9]은 수술 후 1달까지 중심와아래 맥락막두께는 변화가 없다고 보고하였다.
이처럼 이전 연구 결과들 사이에 차이가 있기 때문에, 본 저자들은 백내장수술 후 중심와아래 맥락막두께와 맥락막혈관 지수에 영향을 미칠 수 있는 세부 항목들을 구분하여 수술 전, 수술 1주 후, 수술 1달 후 그리고 수술 2달 후의 중심와아래 맥락막두께와 맥락막혈관 지수를 EDI-OCT를 이용하여 변화를 측정하였다. 백내장수술 후 맥락막혈관층에 미치는 요인들에 관한 연구는 아직까지 보고된 바가 없고 맥락막혈관의 변화는 여러 망막질환과 관련이 있다[
1,
8]. 따라서 임상적 요인에 따라 백내장수술 후 맥락막혈관층의 변화를 알아보는 것은 추후 여러 망막질환의 위험을 알아볼 수 있으므로 의의가 있다.
본 연구에서 맥락막두께는 마취 방법과 고혈압 유무에 관계없이 수술 1주 후 증가하였다가 이후 감소하는 양상을 확인할 수 있었으며, Ohsugi et al [
3]과 유사한 결과를 보였다[
1,
6,
9]. 환자군을 마취 종류 및 고혈압 유무로 나누었을 때 그 변화 양상의 차이는 유의하지 않았지만, 당뇨의 유무로 환자를 비교하였을 때 그룹 간에도 유의한 차이를 보였다. 이는 당뇨의 유무에 상관없이 맥락막두께가 수술 후 3달까지 증가하는 양상을 보였지만, 두 그룹 간에 유의한 차이는 보이지 않았다는 Yip et al [
6]과는 다른 결과를 보였다. 하지만 본 저자들은 중심와아래 맥락막두께만을 측정하였지만, Yip et al [
6]은 중심와아래, 비측과 이측으로 중심와아래에서 500 μm 떨어진 지점까지 총 3지점의 맥락막두께의 평균값으로 계산하였기에 본 연구 결과와 차이가 있을 수 있으며, 맥락막혈관 지수까지 포함한 본 연구에서 더 포괄적 맥락막 변화를 확인 가능할 것으로 사료된다.
백내장수술 후 맥락막의 두께 변화에 대해 아직까지 확인된 기전은 없다. 백내장수술 후 방수에 증가된 프로스타글란딘, 성장인자 등의 여러 염증인자가 유리체강을 통과한 후, 망막과 맥락막에 도달하여 혈액망막장벽(blood-retinal barrier)을 파괴하면서 맥락막두께에 영향을 미친다고 생각되고 있다[
1,
3,
19]. 당뇨가 있는 경우 이미 유리체강내 proinflammatory 사이토카인의 증가 등의 변화가 일어나 있으며, 혈관의 투과성이 더 취약하여 당뇨가 없는 경우보다 중심와아래 맥락막의 변화가 더 유의하게 발생할 것으로 생각해 볼 수 있다. 따라서 당뇨가 있는 환자에서 백내장수술을 하였을 때 신생혈관, 연령관련황반변성, 당뇨망막병증, 망막부종 등과 같은 망막질환의 위험이 증가할 것을 생각할 수 있다[
1,
8].
점안마취를 시행했거나 당뇨나 고혈압이 없는 환자군의 중심와아래 맥락막두께는 수술 1주 이후 지속적으로 감소하였고, 맥락막혈관 지수는 모두 수술 1달 후까지 유의하게 증가하였다가 감소하는 변화를 보였다. 구후마취를 시행하거나 당뇨나 고혈압이 있는 환자군에서 중심와아래 맥락막두께는 수술 1주 이후 지속적으로 감소하지만 맥락막혈관 지수는 모두 수술 2달까지 유의하게 증가하였다. 이처럼 맥락막두께와 맥락막혈관 지수의 양상이 일치하지 않는 것은 중심와아래 맥락막두께는 수술 1주 후부터 정상화되지만, 맥락막혈관의 증가된 총 면적은 정상화되는 데 시간이 더 걸리기 때문으로 생각해 볼 수 있다.
그동안 백내장수술 이후 맥락막의 두께와 맥락막혈관 지수의 변화에 대한 여러 연구들에서 이들 변화 원인에 대한 가설로 수술 중 사용한 초음파의 세기와 시간이 연관 있을 것이라는 의문들을 제시하였다[
1,
6]. 본 연구에서 초음파의 세기나 시간은 중심와아래 맥락막두께나 맥락막혈관 지수의 변화에 영향을 주지 않았다. 수술 중 발생하는 물리적 요인은 백내장수술 후 맥락막혈관의 변화에 영향을 주지 않아 중심와아래 맥락막두께나, 맥락막혈관 지수에도 영향을 주지 않는 것으로 생각된다[
1,
19]. 하지만 본 연구에서는 초음파의 사용이 극단적으로 많은 성숙 백내장은 배제되었기에 이에 대해서는 추후 확인이 더 필요하다.
본 연구는 몇 가지 한계점이 있다. 먼저 후향적 의무기록 분석으로 백내장수술 전후 EDI-OCT의 기록이 있는 경우가 한정적이었기에, 관찰 대상군이 62명의 95안으로 적다는 단점이 있다. 두 번째로, 경과 관찰 기간이 수술 후 2개월로 짧다는 점과 환자가 가진 고혈압이나 당뇨의 여부만을 확인하고 질환의 중증도나 조절 정도에 대하여 확인하지 않았다는 한계점도 있다. 세 번째로는 OCT를 촬영하는 시간을 일정하게 정할 수 없어서 환자 간의 맥락막의 일중 변동에 대해 고려하지 못한 점도 이 연구의 한계이다[
1-
3,
18,
20]. 네 번째로, 기술적인 측면에서 EDI-OCT상에서 맥락막의 넓이와 혈관층을 소프트웨어상에서 자동으로 측정할 수 없고 수동으로 측정해야 했다[
14-
17]. 또한, OCT 중 시신경유두와 황반오목을 가로지르는 단면만을 이용하여 측정을 하였기에 맥락막혈관의 꽈리 형태나 혈관의 구부러진 면적 등은 반영되지 않았다. 따라서 조금 더 많은 환자군의 6개월 이상의 데이터가 필요하며, 맥락막의 입체적인 부분의 면적을 반영한 연구들이 필요하다[
6,
20].
본 연구에서는 백내장수술 후, 중심와아래 맥락막두께와 맥락막혈관 지수의 변화와 변화에 영향을 줄 수 있는 마취방법, 당뇨와 고혈압의 유무, 초음파의 세기와 시간 등 임상적 요인들과의 관계를 살펴보았다. 백내장수술 후 중심와아래 맥락막두께는 임상적 요인과 상관없이 수술 전과 비교하여 수술 1주 후 증가하였다가 이후 감소하는 양상을 보였고, 맥락막혈관 지수는 임상적 요인에 따라 수술 2달 후까지 증가하였다. 본 연구에서 확인한 임상적 요인들 중에서 당뇨의 유무가 백내장수술 후 맥락막혈관의 변화 양상에 영향을 주는 요인으로 생각된다. 수술 중 사용한 초음파의 세기와 시간은 수술 후 맥락막혈관에 미치는 영향이 적었다.
Figure 1.
The technique of image binarization for choroid with Niblack auto local threshold tool. (A) The original enhanced depth imaging-optical coherence tomography scan. Choroidal thickness (red arrow). (B) The total choroidal area of scan passing thorough the fovea. (C) Image binarization by ImageJ. (D) The image was reconverted to RGB image showing dark areas (luminal area, red arrow) and light areas (stromal area, red arrowhead). (E) The binarized image over the original image.
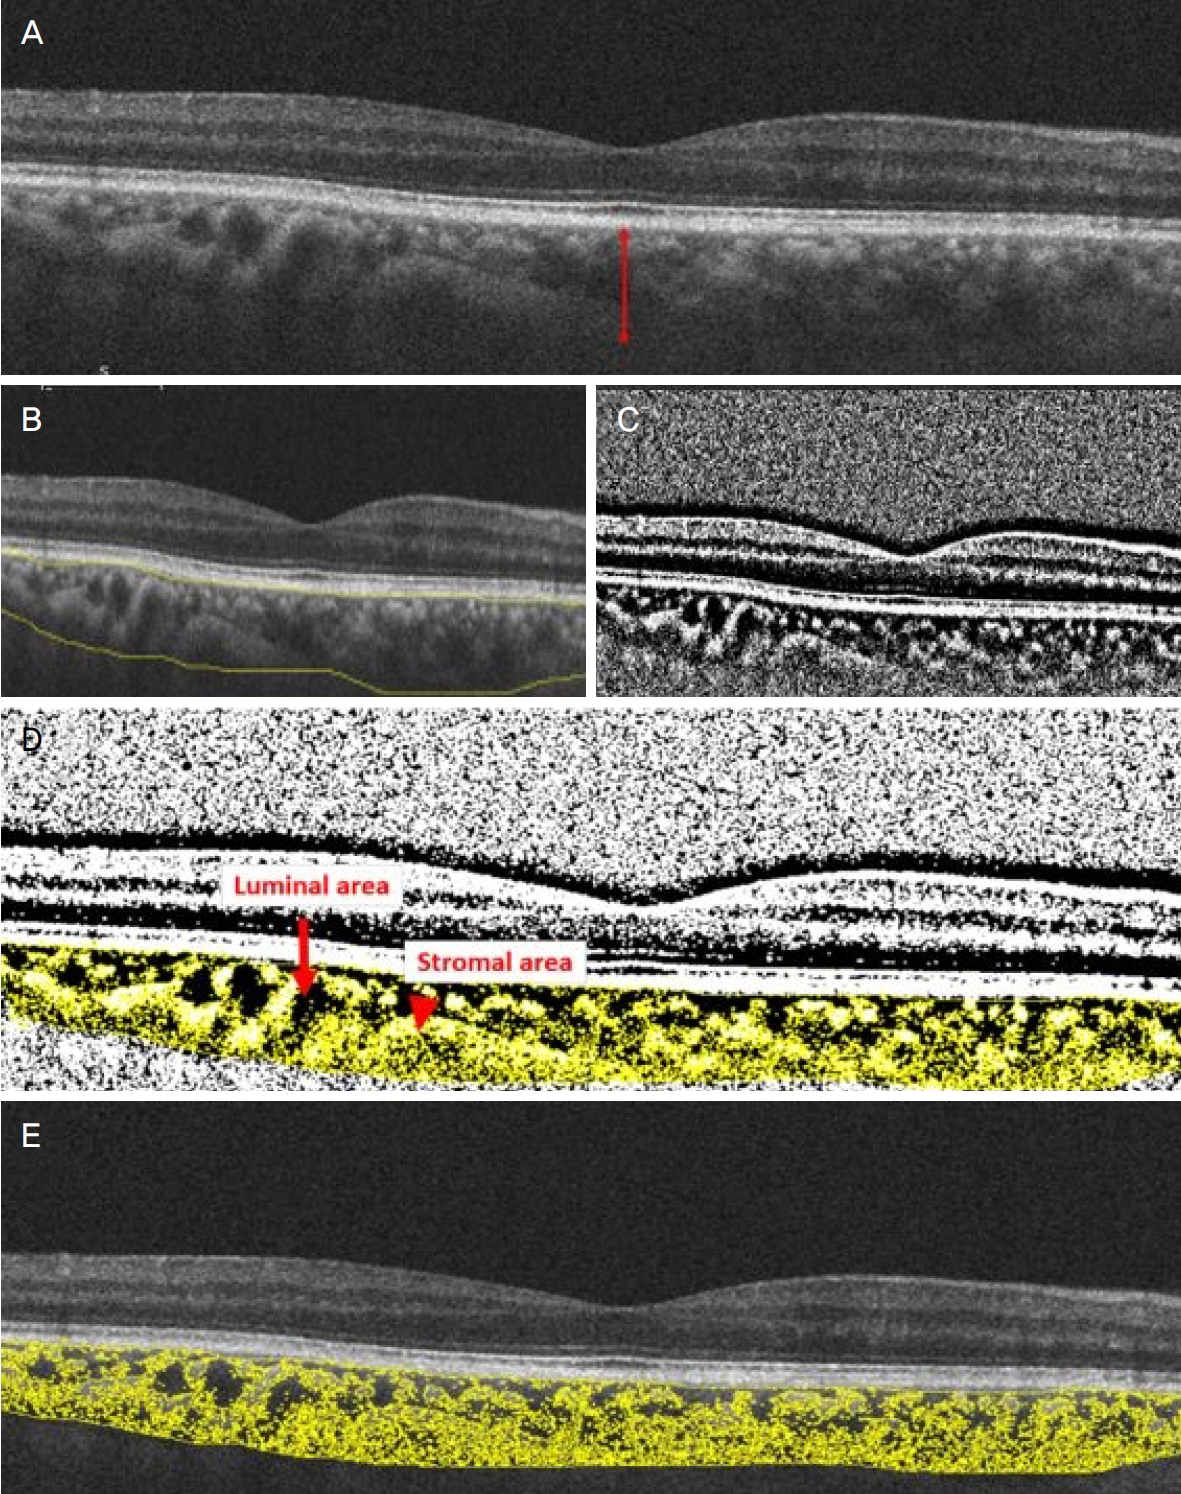
Figure 2.
Mean choroidal thinckness (CT) in the change over time. Mean CT (μm) depending on receiving operation, type of anesthesia, and the presence of diabetic mellitus (DM) or hypertension (HTN) before surgery, 1 week (WK), 1 month (M), and 2 months after surgery. There are significant changes over time (all p < 0.001). (A) CT increased and then decreased after 1 week, regardless of the operation received. There was a significant difference in the change over time between the two groups (p < 0.001). (B) CT increased and then decreased after 1 week, regardless of the type of anesthesia. There was no significant difference in the change over time between the two groups (p = 0.421). (C) CT increased and then decreased after 1 week, regardless of the presence of DM. There was a significant difference in the change over time between the two groups (p = 0.037). (D) CT increased and then decreased after 1 week, regardless of the presence of HTN. There was no significant difference in the change over time between the two groups (p = 0.281). Data was compared with preoperative value by repeated measure analysis of variance with Bonferroni’s method.
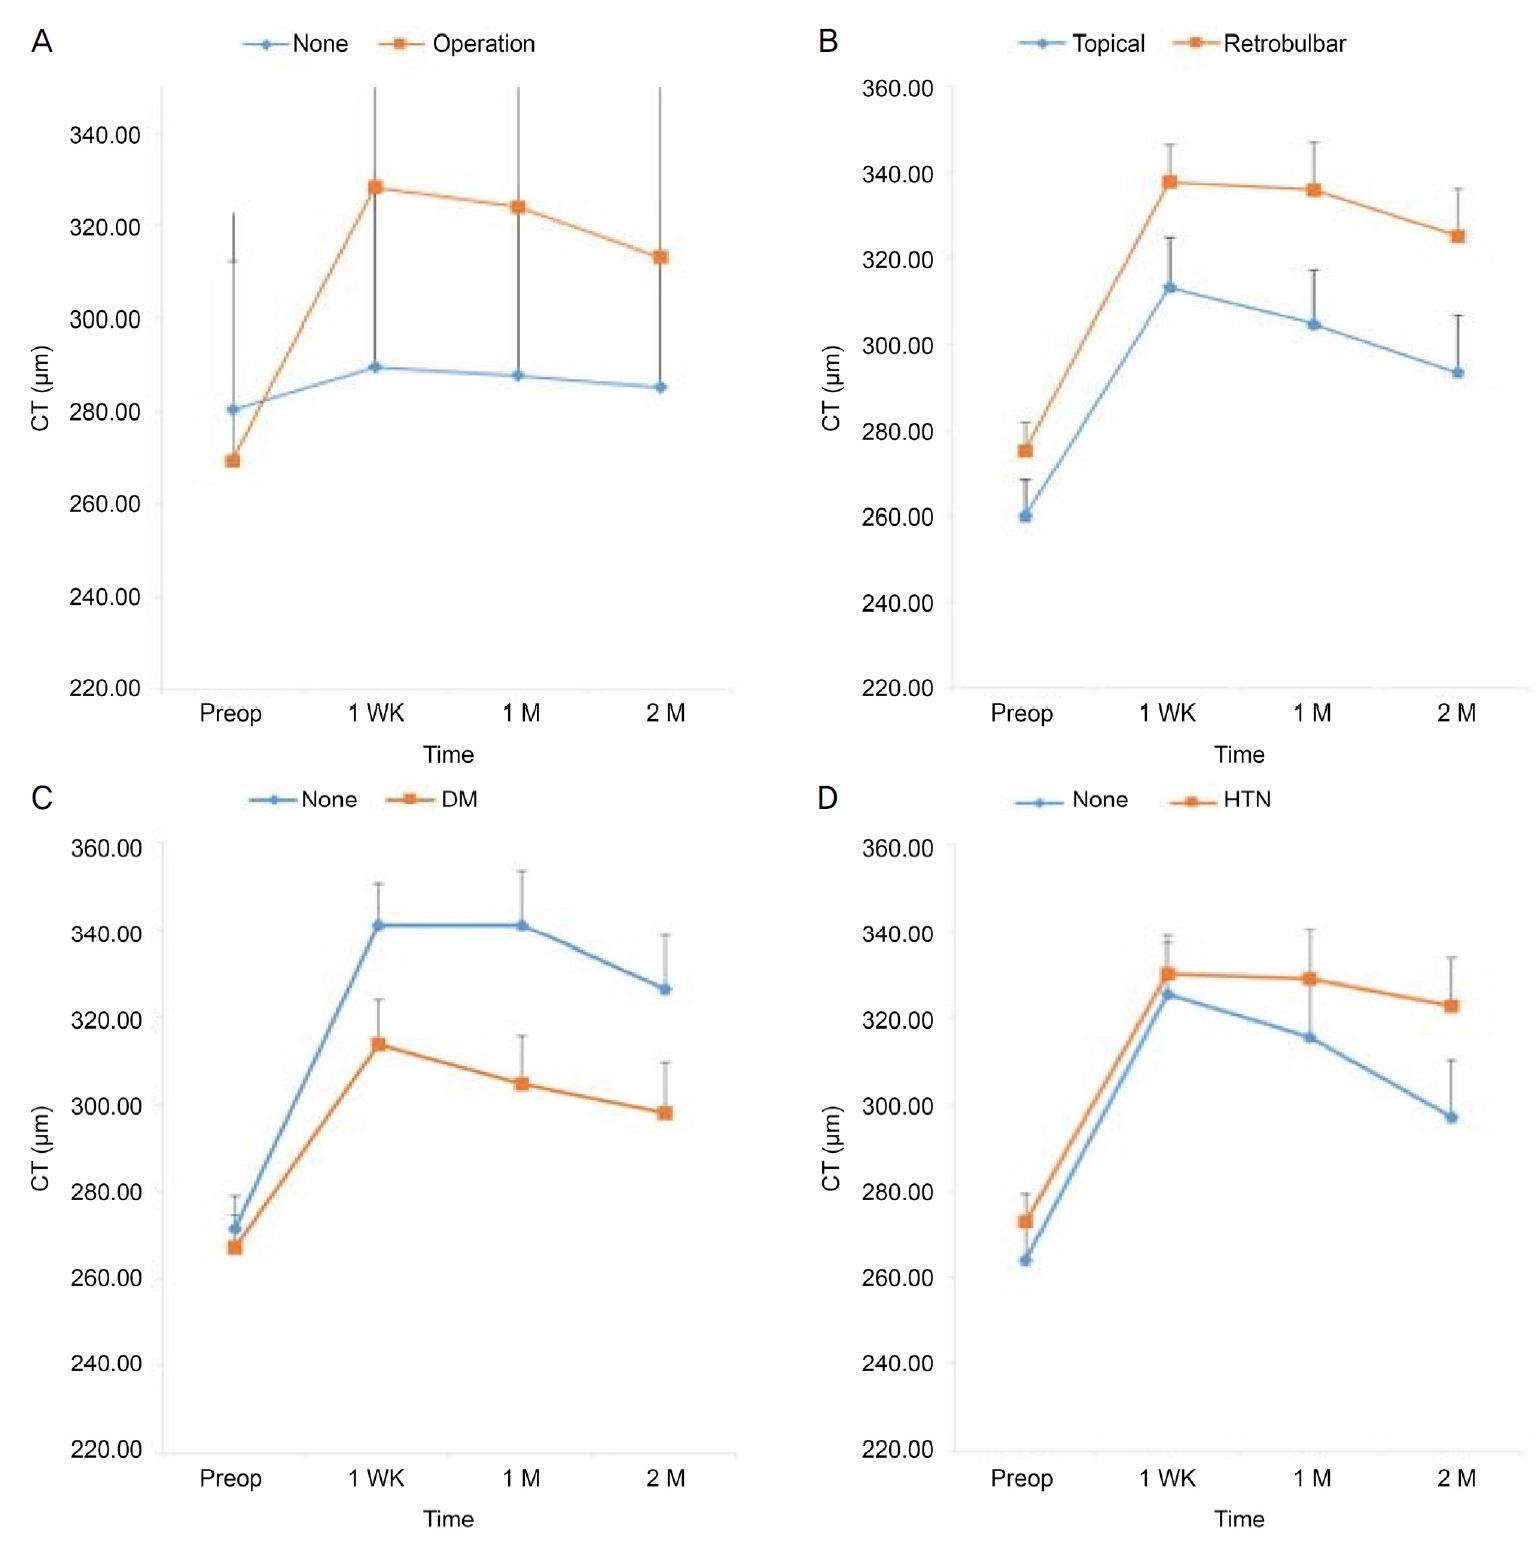
Figure 3.
Mean choroidal vascularity index (CVI) in the change over time. Mean CVI (%) depending on receiving operation, type of anesthesia, and the presence of diabetic mellitus (DM) or hypertension (HTN) before surgery, 1 week (WK), 1 month (M) and 2 months after surgery. There are significant changes over time (All p < 0.001). (A) CVI continued to increase up to 2 months. There was a significant difference in the change over time between the two groups (p < 0.001). (B) Within topical anesthesia, CVI increased and then decreased after 1 month. Within retrobulbar anesthesia, CVI continued to increase up to 2 months. There was no significant difference in the change over time between the two groups (p = 0.409). (C) Without DM, CVI increased and then decreased after 1 month. With DM, CVI continued to increase up to 2 months. There was no significant difference in the change over time between the two groups (p = 0.682). (D) Without HTN, CVI increased and then decreased after 1 month. With HTN, CVI continued to increase up to 2 months. There was no significant difference in the change over time between the two groups (p = 0.10). Data was compared with preoperative value by repeated measure analysis of variance with Bonferroni’s method.
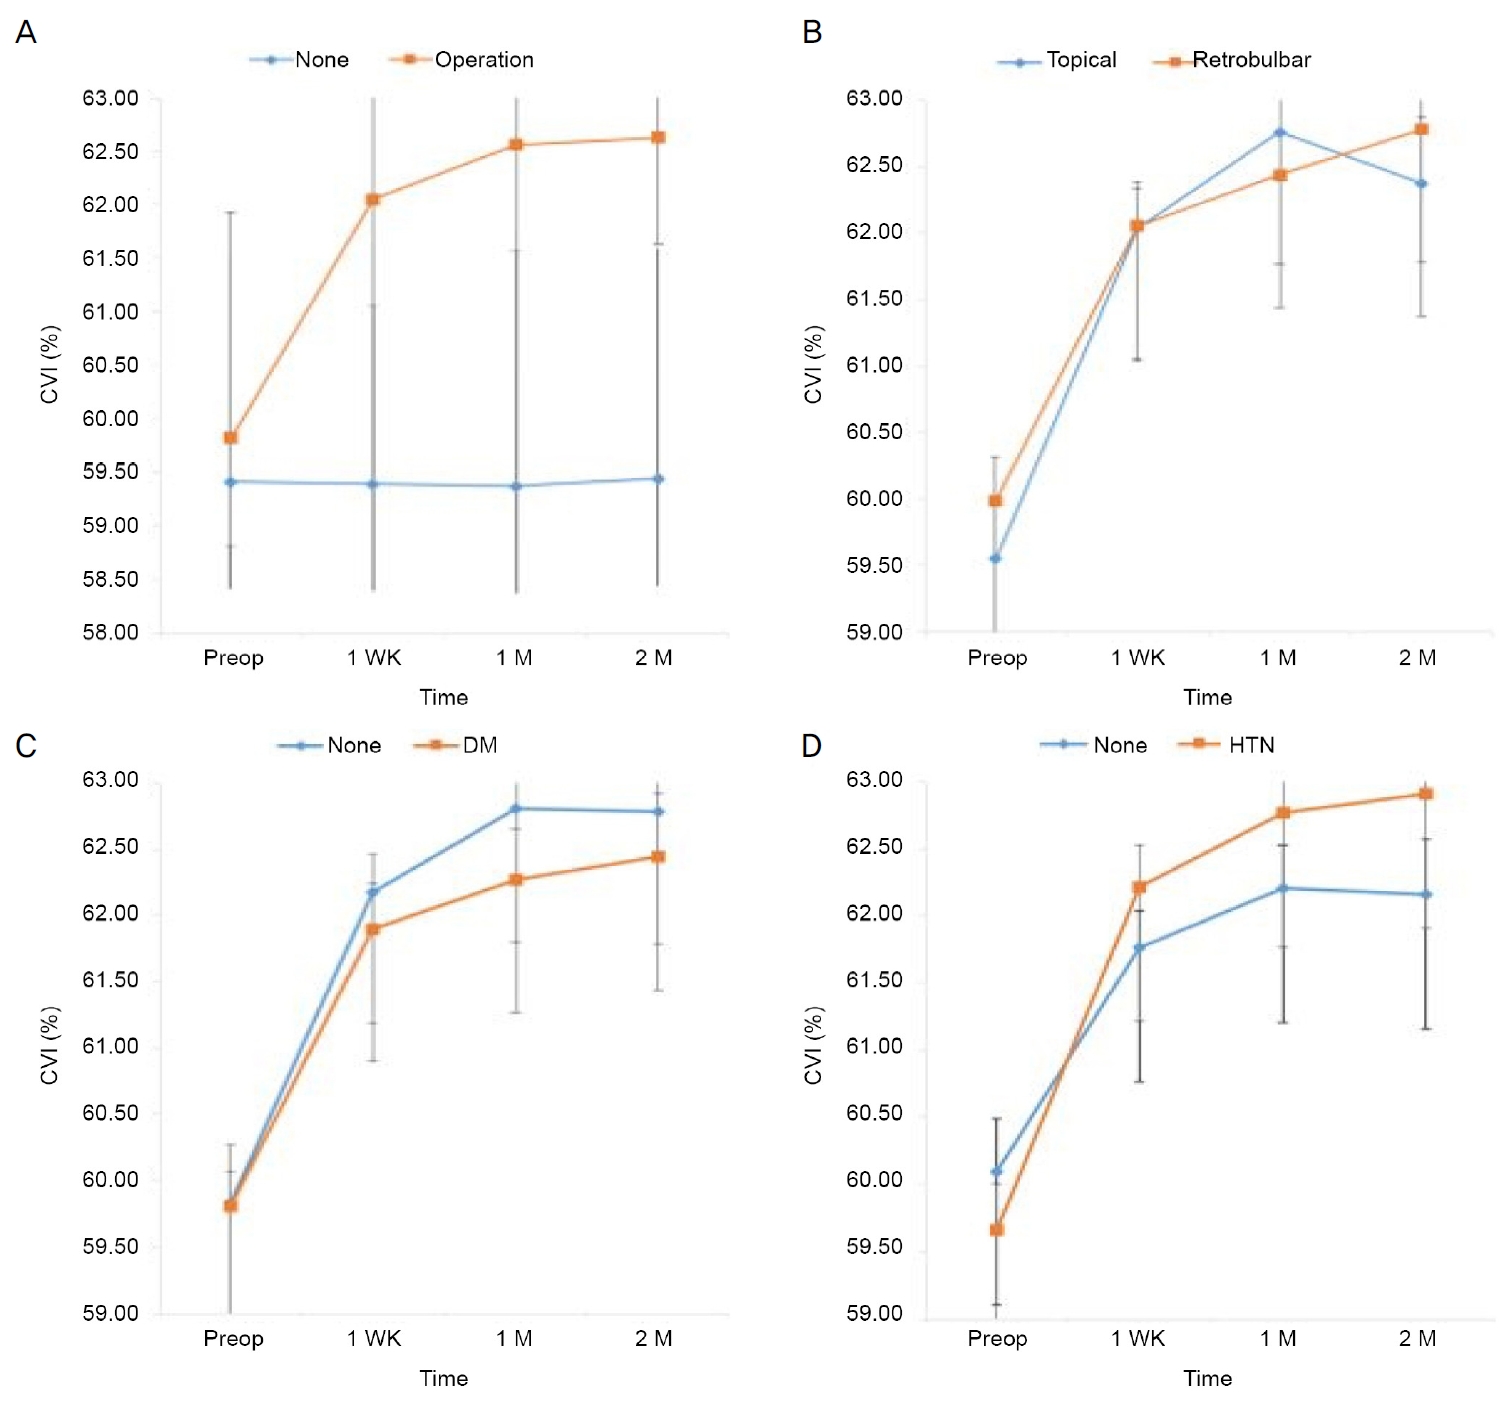
Figure 4.
Scatterplots showing the correlation in the difference at postop 1 week. (A) Correlation between phacoemulsification power (%) and the difference of choroidal thickness (CT) at postop 1 week (r = 0.208, p = 0.090). (B) Correlation between phacoemulsification time(s) and the difference of CT at postop 1 week (r = 0.049, p = 0.695). (C) Correlation between phacoemulsification power (%) and the difference of choroidal vascularity index (CVI) at postop 1 week (r = -0.003, p = 0.982). (D) Correlation between phacoemulsification time(s) and the difference of CVI at postop 1 week (r = 0.011, p = 0.930). Data was compared with difference of CT or CVI in postop 1 week by Pearson Correlation Coefficient. Phacopower is the equivalent average ultrasonic power (FP3) which is the ratio of cumulative dissipated energy (CDE) to ultrasonic total time. CDE is calculated as: (longitudinal time × average longitudinal power) + (torsional time × 0.4 × average torsional amplitude). The factor 0.4 represents approximate reduction of heat dissipated at incision as compared to conventional phaco. Phacotime is the total longitudinal power on time.
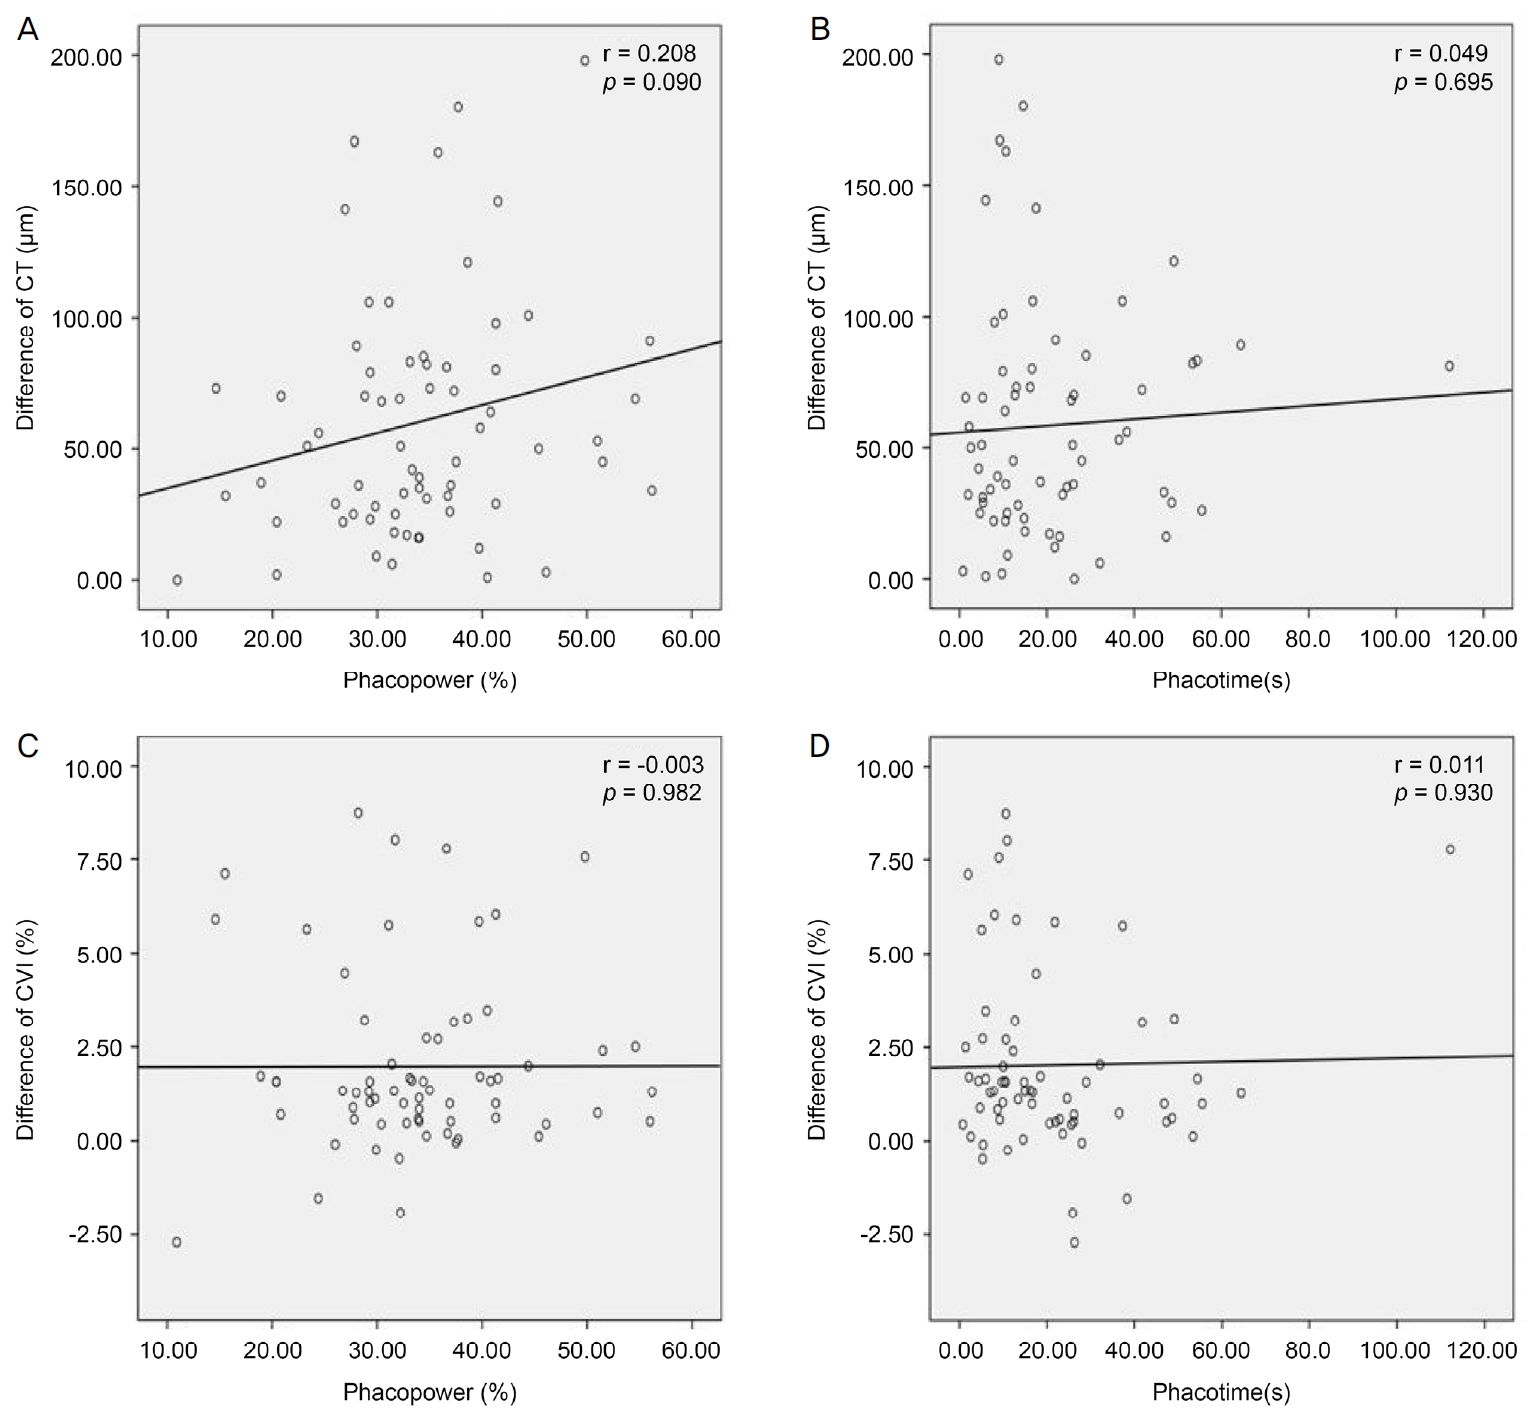
Table 1.
Patient demographics and clinical characteristics of the subjects
|
Patient demographics |
Value |
|
Number of patients (eyes) |
62 (95) |
|
Age (years) |
68.0 ± 10.0 (46-87) |
|
Sex (eyes) |
|
|
Male |
30 (48) |
|
Female |
32 (47) |
|
Eyes without op |
28 |
|
Eyes with op |
67 |
|
Laterality (OD:OS) |
33:34 |
|
Anesthesia |
|
|
Topical |
25 |
|
Retrobulbar |
42 |
|
Systemic disease |
|
|
DM |
31 |
|
HTN |
42 |
Table 2.
Association between the type of anesthesia and the presence of past history
|
Parameter |
Anesthesia |
DM |
HTN |
|
Anesthesia |
- |
0.468 |
0.163 |
|
DM |
0.468 |
- |
0.826 |
|
HTN |
0.163 |
0.826 |
- |
Table 3.
Preoperative CT and postoperative variance of CT
|
Parameter |
Preoperative |
Variance in postop 1 week |
p-value*
|
Variance in postop 1 month |
p-value*
|
Variance in postop 2 months |
p-value*
|
|
Eyes without op (n = 28) |
280.43 ± 42.39 |
9.25 ± 31.98 |
0.14 |
7.429 ± 28.44 |
0.18 |
4.89 ± 36.39 |
0.48 |
|
Eyes with op (n = 67) |
269.55 ± 42.86 |
58.93 ± 44.92 |
<0.001 |
54.689 ± 6.86 |
<0.001 |
43.76 ± 54.05 |
<0.001 |
Table 4.
Preoperative CVI and postoperative variance of CVI
|
Parameter |
Preoperative |
Variance in postop 1 week |
p-value*
|
Variance in postop 1 month |
p-value*
|
Variance in postop 2 months |
p-value*
|
|
Eyes without op (n = 28) |
59.41 ± 2.12 |
-0.02 ± 1.31 |
0.951 |
-0.04 ± 1.57 |
0.890 |
0.03 ± 1.87 |
0.940 |
|
Eyes with op (n = 67) |
59.82 ± 2.11 |
2.23 ± 2.32 |
<0.001 |
2.74 ± 2.47 |
<0.001 |
2.81 ± 2.77 |
<0.001 |
|
Depending on anesthesia |
|
|
|
|
|
|
|
|
|
Topical (n = 25) |
59.55 ± 2.11 |
2.49 ± 2.58 |
<0.001 |
3.21 ± 2.55 |
<0.001 |
2.83 ± 3.05 |
<0.001 |
|
Retrobulbar (n = 42) |
59.99 ± 2.12 |
2.07 ± 2.17 |
<0.001 |
2.45 ± 2.42 |
<0.001 |
2.79 ± 2.63 |
<0.001 |
|
Depending on DM |
|
|
|
|
|
|
|
|
None DM (n = 36) |
59.83 ± 2.60 |
2.34 ± 2.22 |
<0.001 |
2.97 ± 2.51 |
<0.001 |
2.95 ± 2.60 |
<0.001 |
|
DM (n = 31) |
59.81 ± 1.39 |
2.09 ± 2.46 |
<0.001 |
2.46 ± 2.44 |
<0.001 |
2.63 ± 2.98 |
<0.001 |
|
Depending on HTN |
|
|
|
|
|
|
|
|
None HTN (n = 25) |
60.10 ± 1.97 |
1.67 ± 1.99 |
<0.001 |
2.11 ± 2.15 |
<0.001 |
2.06 ± 2.43 |
<0.001 |
|
HTN (n = 42) |
59.66 ± 2.20 |
2.56 ± 2.46 |
<0.001 |
3.11 ± 2.60 |
<0.001 |
3.25 ± 2.89 |
<0.001 |
REFERENCES
2) Grossniklaus HE, Green WR. Choroidal neovascularization. Am J Ophthalmol 2004;137:496-503.


3) Ohsugi H, Ikuno Y, Ohara Z, et al. Changes in choroidal thickness after cataract surgery. J Cataract Refract Surg 2014;40:184-91.
4) Spaide RF, Koizumi H, Pozzoni MC. Enhanced depth imaging spectral-domain optical coherence tomography. Am J Ophthalmol 2008;146:496-500.
5) Querques G, Lattanzio R, Querques L, et al. Enhanced depth imaging optical coherence tomography in type 2 diabetes. Invest Ophthalmol Vis Sci 2012;53:6017-24.
6) Yip VC, Laude A, Tan KA, et al. A longitudinal study of choroidal changes following cataract surgery in patients with diabetes. Diab Vasc Dis Res 2019;16:369-77.
7) Brito PN, Rosas VM, Coentrão LM, et al. Evaluation of visual acuity, macular status, and subfoveal choroidal thickness changes after cataract surgery in eyes with diabetic retinopathy. Retina 2015;35:294-302.
8) Shahzad R, Siddiqui MAR, Zafar S, et al. Choroidal thickness changes following cataract surgery using swept source optical coherence tomography. Can J Ophthalmol 2018;53:60-4.
9) Falcão MS, Gonçalves NM, Freitas-Costa P, et al. Choroidal and macular thickness changes induced by cataract surgery. Clin Ophthalmol 2014;8:55-60.
10) Noda Y, Ogawa A, Toyama T, Ueta T. Long-term increase in subfoveal choroidal thickness after surgery for senile cataracts. Am J Ophthalmol 2014 158:455-9. e1.
12) Gudauskiene G, Matuleviciute I, Mockute R, et al. Changes in subfoveal choroidal thickness after uncomplicated cataract surgery. Biomed Pap Med Fac Univ Palacky Olomouc Czech Repub 2019;163:179-83.
13) Margolis R, Spaide RF. A pilot study of enhanced depth imaging optical coherence tomography of the choroid in normal eyes. Am J Ophthalmol 2009;147:811-5.
14) Tan KA, Laude A, Yip V, et al. Choroidal vascularity index-a novel optical coherence tomography parameter for disease monitoring in diabetes mellitus? Acta Ophthalmol 2016;94:e612-6.
15) Agrawal R, Li LK, Nakhate V, et al. Choroidal vascularity index in Vogt-Koyanagi-Harada disease: an EDI-OCT derived tool for monitoring disease progression. Transl Vis Sci Technol 2016;5:7.
16) Sonoda S, Sakamoto T, Yamashita T, et al. Choroidal structure in normal eyes and after photodynamic therapy determined by binarization of optical coherence tomographic images. Invest Ophthalmol Vis Sci 2014;55:3893-9.
17) Schindelin J, Arganda-Carreras I, Frise E, et al. Fiji: an open-source platform for biological-image analysis. Nat Methods 2012;9:676-82.
18) Kinoshita T, Mitamura Y, Shinomiya K, et al. Diurnal variations in luminal and stromal areas of choroid in normal eyes. Br J Ophthalmol 2017;101:360-4.
19) Xu H, Chen M, Forrester JV, Lois N. Cataract surgery induces retinal pro-inflammatory gene expression and protein secretion. Invest Ophthalmol Vis Sci 2011;52:249-55.
20) Goud A, Singh SR, Sahoo NK, et al. New insights on choroidal vascularity: a comprehensive topographic approach. Invest Ophthalmol Vis Sci 2019;60:3563-9.
Biography
이준혁 / Junhyuck Lee
가톨릭대학교 의과대학 부천성모병원 안과학교실
Department of Ophthalmology, Bucheon St. Mary’s Hospital, College of Medicine, The Catholic University of Korea


 PDF Links
 PubReader
 ePub Link
 Full text via DOI
 Download Citation
 Print
Print